RBgrid in Home Assistant, MQTT and your own code
Every measurement point is published to Home Assistant over MQTT discovery, with a table for the Energy dashboard. REST and WebSocket APIs with a published schema for anything else — all on your home network.
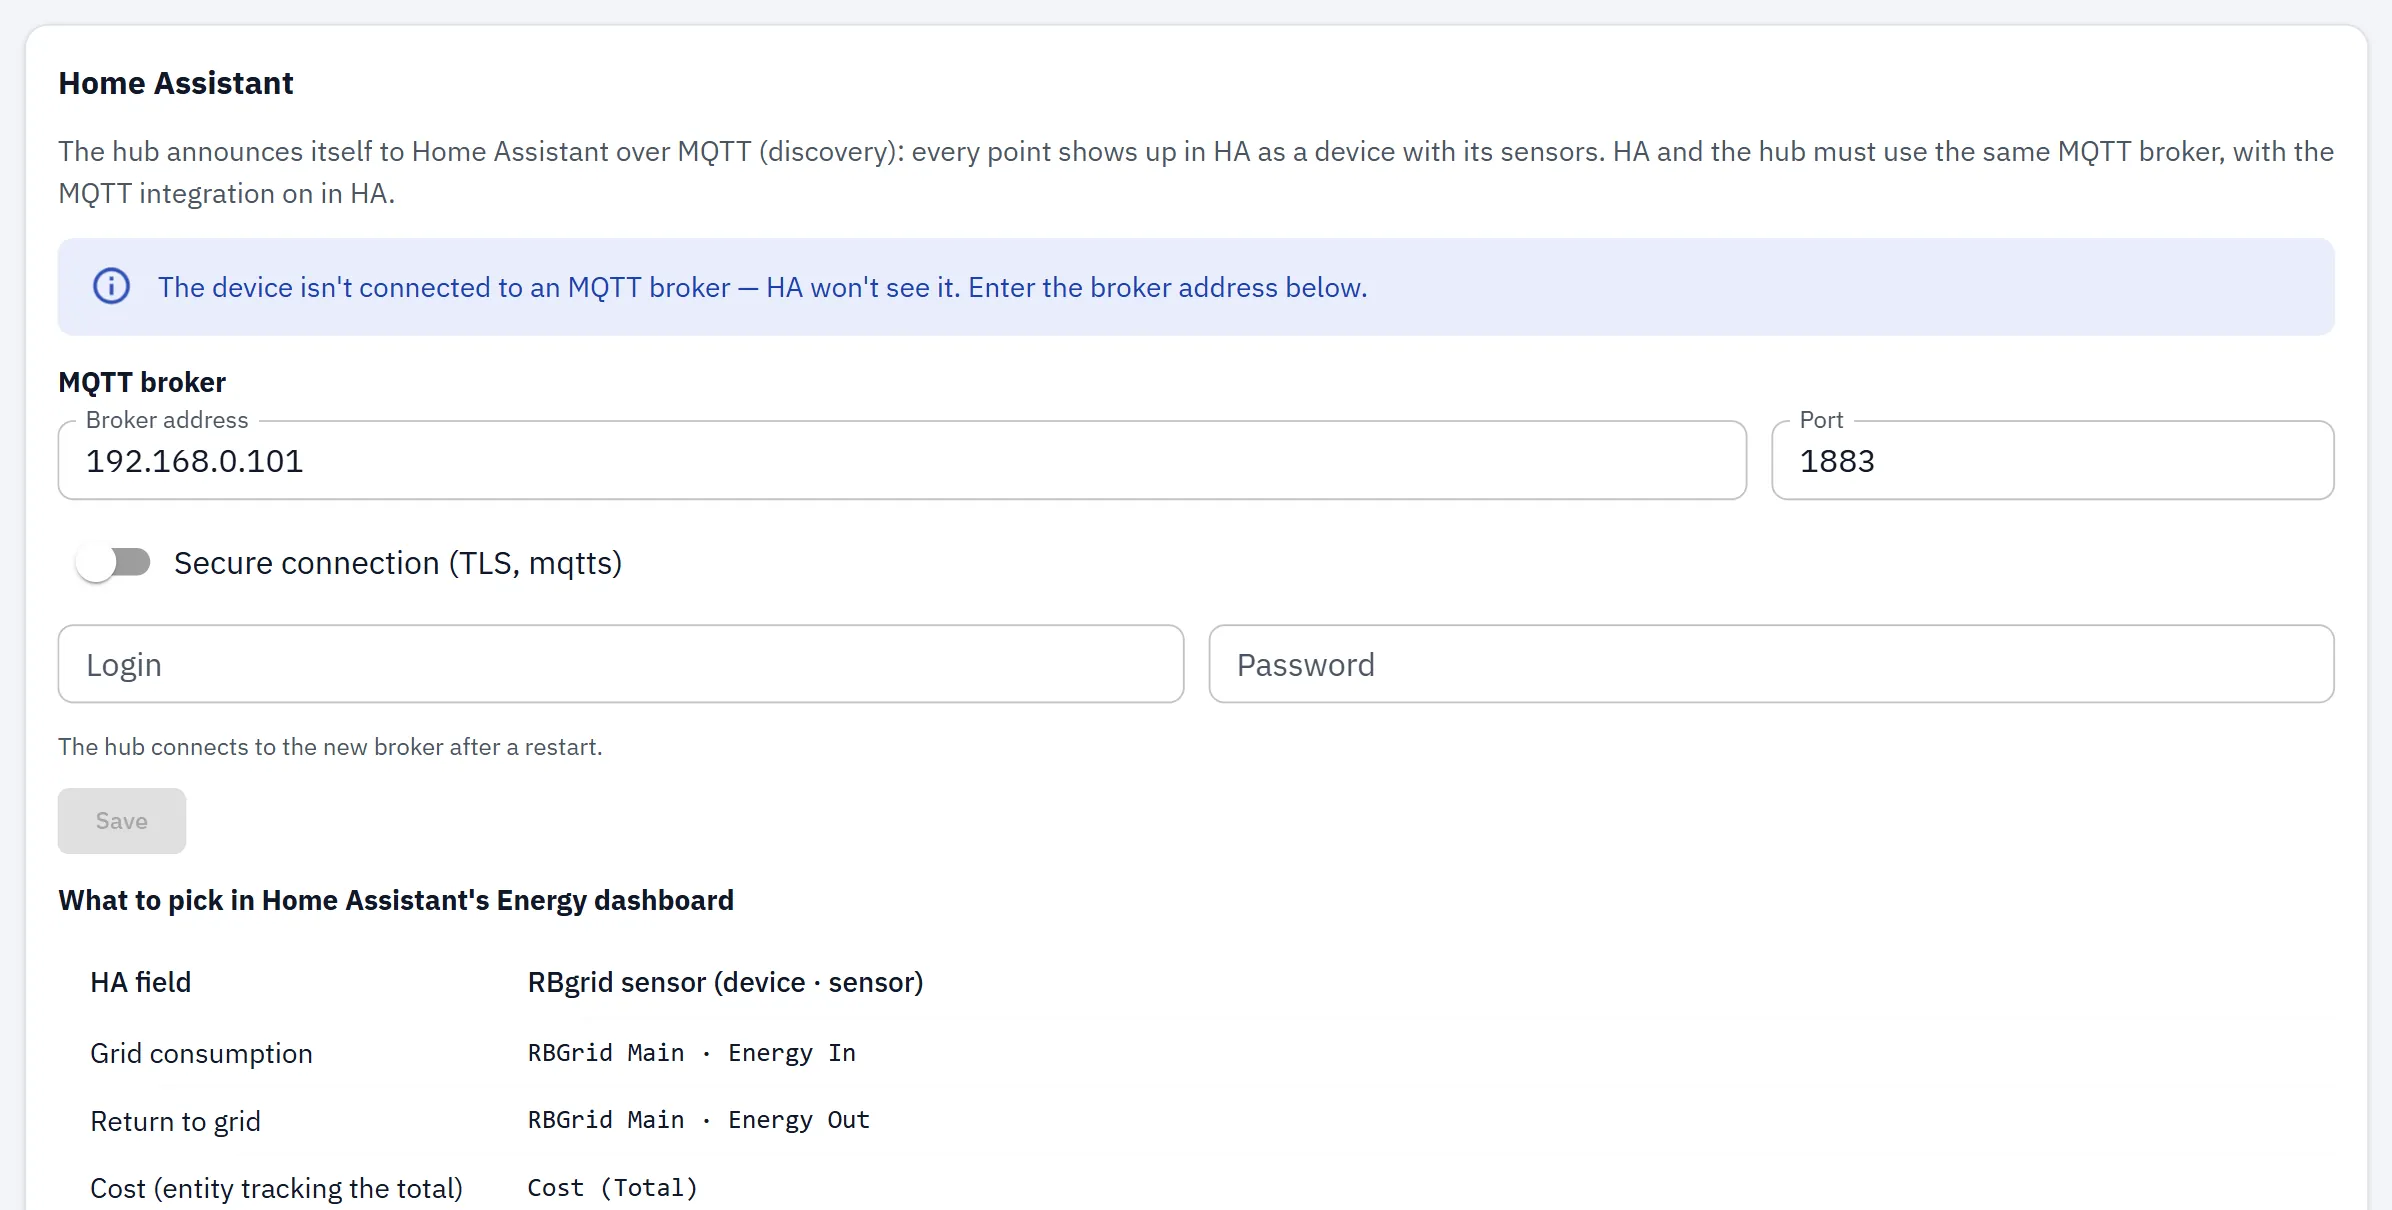
Home Assistant
The hub publishes every point to HA over MQTT discovery; a table tells you what to add to the Energy dashboard.
Per hub
Net Power, Frequency, Cost (Total/Day), Export value (Total/Day) — shown as "Revenue (Total/Day)" in v1.1.0 and v1.1.1 — Bus Voltage
Per point
Current, Power, Reactive Power, Power Factor, Energy In/Out (lifetime, total_increasing) + Day
Energy dashboard picks
| For the Energy dashboard | Pick the RBgrid entity |
|---|---|
| Grid consumption | the supply point's Energy In |
| Return to grid | the supply point's Energy Out |
| Solar panels | the generation point's Energy Out |
| Individual devices | each circuit point's Energy In |
| (cost) | the hub's Cost (Total) sensor |
All are total_increasing kWh sensors, so the Energy dashboard accepts them directly — no utility_meter, no template.
Already have a P1 / DSMR reader? It reads the whole-house total at the meter; RBgrid measures each circuit behind it — the two complement each other. RBgrid does not read the P1 port itself.
MQTT, WebSocket and REST
mqttFixed topics
rbgrid/<mac12>/telemetry|status|cmd|cmd/resp; the prefix is not configurable. HA discovery underhomeassistant/sensor/…. Only the broker is configurable.- 3-second telemetry
- retained Home Assistant discovery
- a command channel for writes
- you set your own broker (none by default)
- fixed topic prefix
rbgrid/<mac>/….
rest · wsREST for integrators:
/api/v1/summary,/history,/export.csv,/economics. WebSocket telemetry frame v2. Recipes: Node-RED, Grafana.Node-RED and Grafana: read the REST/WebSocket feed or subscribe to MQTT — no plugin needed.
Fixed tariff schedules today — zones, weekends, taxes and VAT, all applied on the device. Hourly / spot-price tariffs are on the roadmap: planned, not shipping.