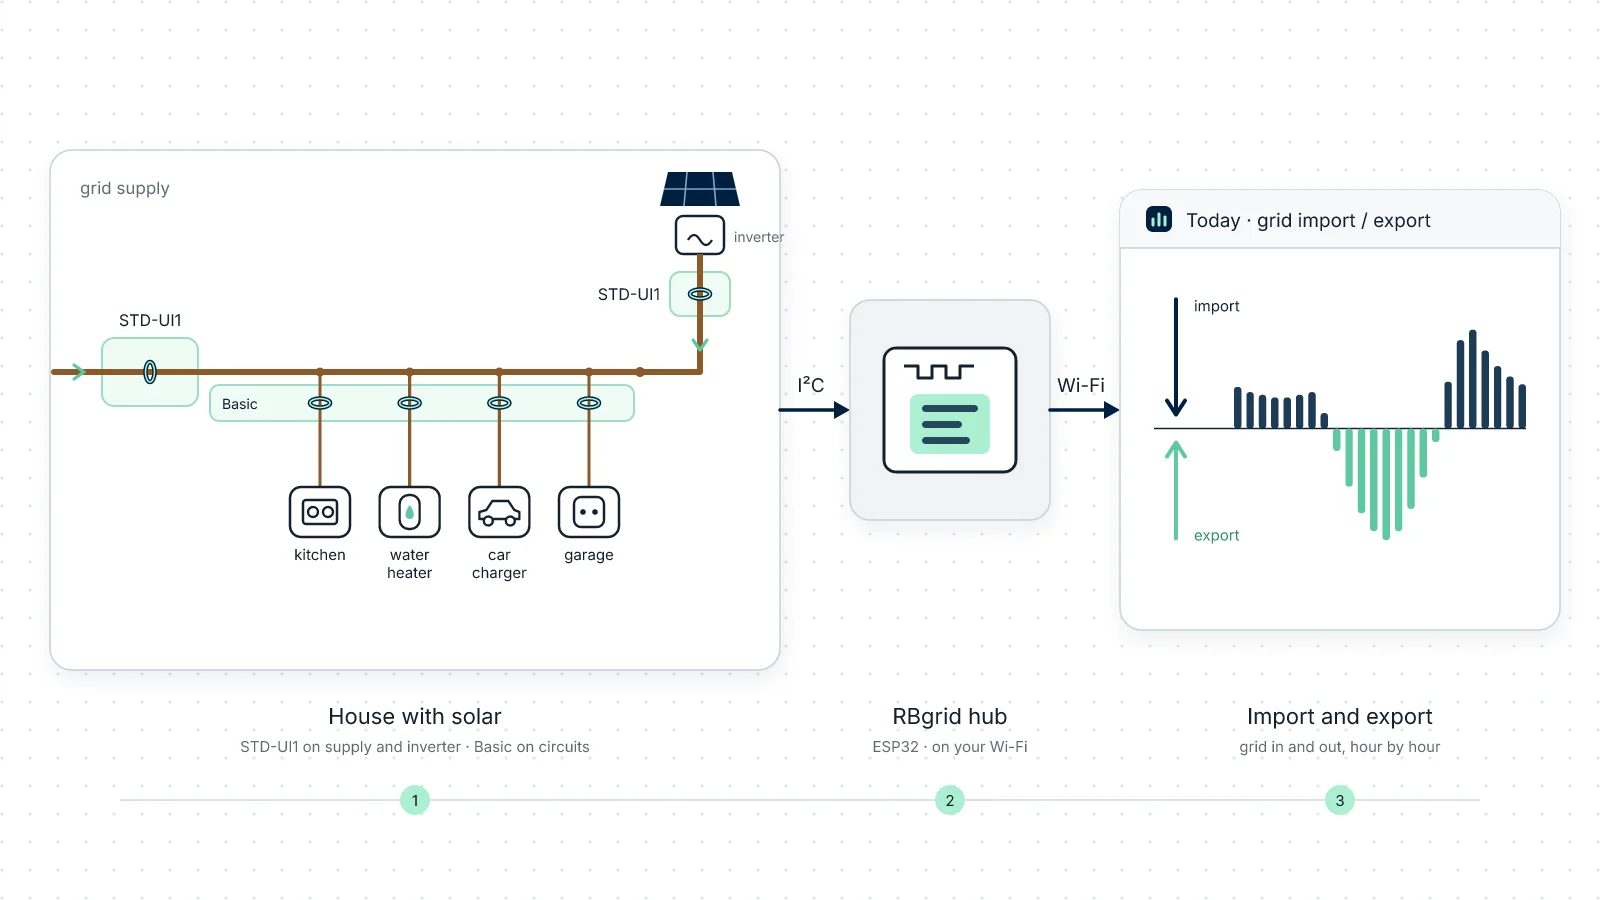
A single-phase house with solar panels on the roof, a car charger in the garage and an electric water heater. The tariff has a day rate and a cheaper night rate, and the supplier pays a fixed price for every kWh sent back to the grid. Around noon on a sunny day the house makes more than it uses. The questions: how much goes out, what is it priced at, and how much of the solar does the house use itself?
This guide builds that house on a real RBgrid hub. Two rbAmp STD-UI1 precise energy meters measure the supply and the inverter line; a Basic module measures the kitchen, the water heater, the car charger and the garage. The app prices what you import at your tariff and what you export at your sell price. It's the same house as the Home with solar site in the live demo, so you can look at the finished result before you build anything. The screenshots in this guide are from the demo and show demo data.
What you'll have at the end
- The power at the supply right now, with its direction: importing or exporting.
- What the solar produces, how much of it the house uses and how much goes out.
- Export measured and priced at your sell price, next to the cost of what you import.
- The power and cost of each circuit at your buy price, today and this month to date.
- History for every circuit, kept on the hub: by hour for 60 days, by day for about 13 months, by month for 3 years. You can download any of it as CSV.
Already monitoring in Home Assistant? The hub can send every circuit's power and energy to Home Assistant over MQTT as well; your existing setup can stay as it is. The cost of each circuit at your tariff, the export value, the history views and the notes are in the RBgrid app. → A power meter for Home Assistant
What you need
| Hub | An ESP32-WROVER board with PSRAM and 16 MB flash, and its USB power supply. |
| Supply meter | One rbAmp STD-UI1, a precise energy meter, in the 60 A kit, on the house's supply. |
| Solar meter | A second STD-UI1 in the 60 A kit, on the inverter line. |
| Circuit module | One rbAmp Basic UI5 for SCT-013: one voltage input and five current channels: kitchen, water heater, car charger, garage, and one free. |
| Clamps | Four voltage-output SCT-013 clamps for the circuits (below). The supply and the inverter line use the STD-UI1s' own sensors. |
| To set it up | A USB cable, a computer with Python (for esptool), your Wi-Fi password, and the short wires between the hub and the modules. |
The STD-UI1 is a precise energy meter: on the supply it gives exact metering of the whole house, and on the inverter line of everything the panels produce. It counts energy on the module itself, in both directions, and keeps import and export separately. Each comes as a 60 A or a 100 A kit, with its current sensor paired with the module at the factory; the sensor isn't replaceable, so there's no clamp to buy and no current sensor to choose in the app. For this house's 63 A main breaker and 25 A inverter line, the 60 A kit for both. Measured on a production module of each kit against a reference meter, with a resistive load: current error ±0.2 % from 0.005 A to 75 A (60 A kit) or to 100 A (100 A kit); voltage error ±0.2 %.
Choose each circuit clamp as the smallest rating at or above the circuit's breaker (see Choosing the clamp sizes).
| Circuit | Module · channel | Breaker | Clamp to buy |
|---|---|---|---|
| Kitchen | Basic UI5 · I0 | 16 A | SCT-013-020 |
| Water heater | Basic UI5 · I1 | 10 A | SCT-013-010 |
| Car charger | Basic UI5 · I2 | 32 A | SCT-013-050 |
| Garage | Basic UI5 · I3 | 16 A | SCT-013-020 |
The demo house has the same two STD-UI1 meters; it spreads the circuits over a Basic UI1 and a Basic UI3 instead of one UI5. Either works; build yours as this guide says. Not sure which clamp you have? See Which SCT-013 do you have?
Safety. For any work inside an electrical panel, call a qualified electrician.
Clamp one conductor only (L) per circuit, never the whole cable: the currents in L and N cancel out.
Why two STD-UI1s? At noon the supply's power reverses, and the solar line is production; a Basic module counts one direction only and doesn't offer the Generation role. An STD-UI1 counts both directions and keeps import and export apart. More under Why the supply and the solar are on STD meters.
1. Wire, flash, connect
- Wire the modules: the two STD-UI1s and the Basic UI5, their voltage inputs and sensors.
- The supply's STD-UI1: its voltage input is wired like a Basic module's: AWG26–22 wire to the L and N terminals, a fuse of up to 0.1 A in the L line. Its sensor goes on the supply conductor with the arrow from the grid towards the house.
- The inverter line's STD-UI1: its voltage input as for the supply's; its sensor on the inverter line with the arrow from the inverter towards the house's panel, the way the energy flows when the panels produce.
- The Basic UI5: its voltage input to L and N through its fuse; the four clamps on I0–I3, each with the arrow pointing towards the load. A Basic module counts one direction only, so a clamp the wrong way round reads nothing.
Place each module within 15 cm of the hub. For longer runs see the bus-length section of the rbAmp wiring guide. The modules' I²C cables are connected to the hub one at a time later, during Add a module, with the hub off.
- Connect only the supply's STD-UI1 to the hub for now (power, GND, SDA, SCL), at its factory I²C address 0x50. → Quick start, step 1
- Flash the hub, join it to your Wi-Fi and open the app, at webapp.rbgrid.io or installed on the hub: follow the Quick start steps 2–4, then come back here.
A new hub makes the module at 0x50 your grid input by itself, the measurement of the whole house, plus a voltage point. There's nothing to bind for it.
2. Run the setup wizard
The app opens with a banner, The hub still has its factory settings. Choose Set up →. → The setup wizard
- Security: set an API token and write it down.
- Site & time: scenario Home, a site name (the demo uses "Demo Home"), your time zone; check the clock shows synchronized.
- Sensors: the grid input is already there. Leave the rest for step 5.
- Tariff: enter the day price, switch on There is a night rate (23:00–07:00) and enter the night price. Leave Price as on the bill — incl. VAT on if your bill prices include VAT, and check the VAT, %: a new hub starts at 21 %. In The grid pays per exported kWh, enter the price your contract pays for export: the quick form sets it as the sell price in each zone.
The demo uses Day 07:00–23:00 at 0.36 and Night 23:00–07:00 at 0.18 per kWh including 20 % VAT, and a sell price of 0.08 per kWh. The demo's plan stores its prices without VAT, so the screenshot below shows 0.30 and 0.15: the same prices, net. Use your own bill's prices.
The quick form leaves net metering off. Step 3 finishes the plan.
3. Set the sell price and net metering
Open Tariffs. → Tariffs
This house's contract has net metering, so switch on Net metering (selling to the grid). Check that each zone has a sell price: your contract's price per exported kWh. There's no need to touch the selling ratio. Then Save.
In app 1.1.4 the zones' sell-price fields show only with net metering on. This house uses net metering, so they're visible.
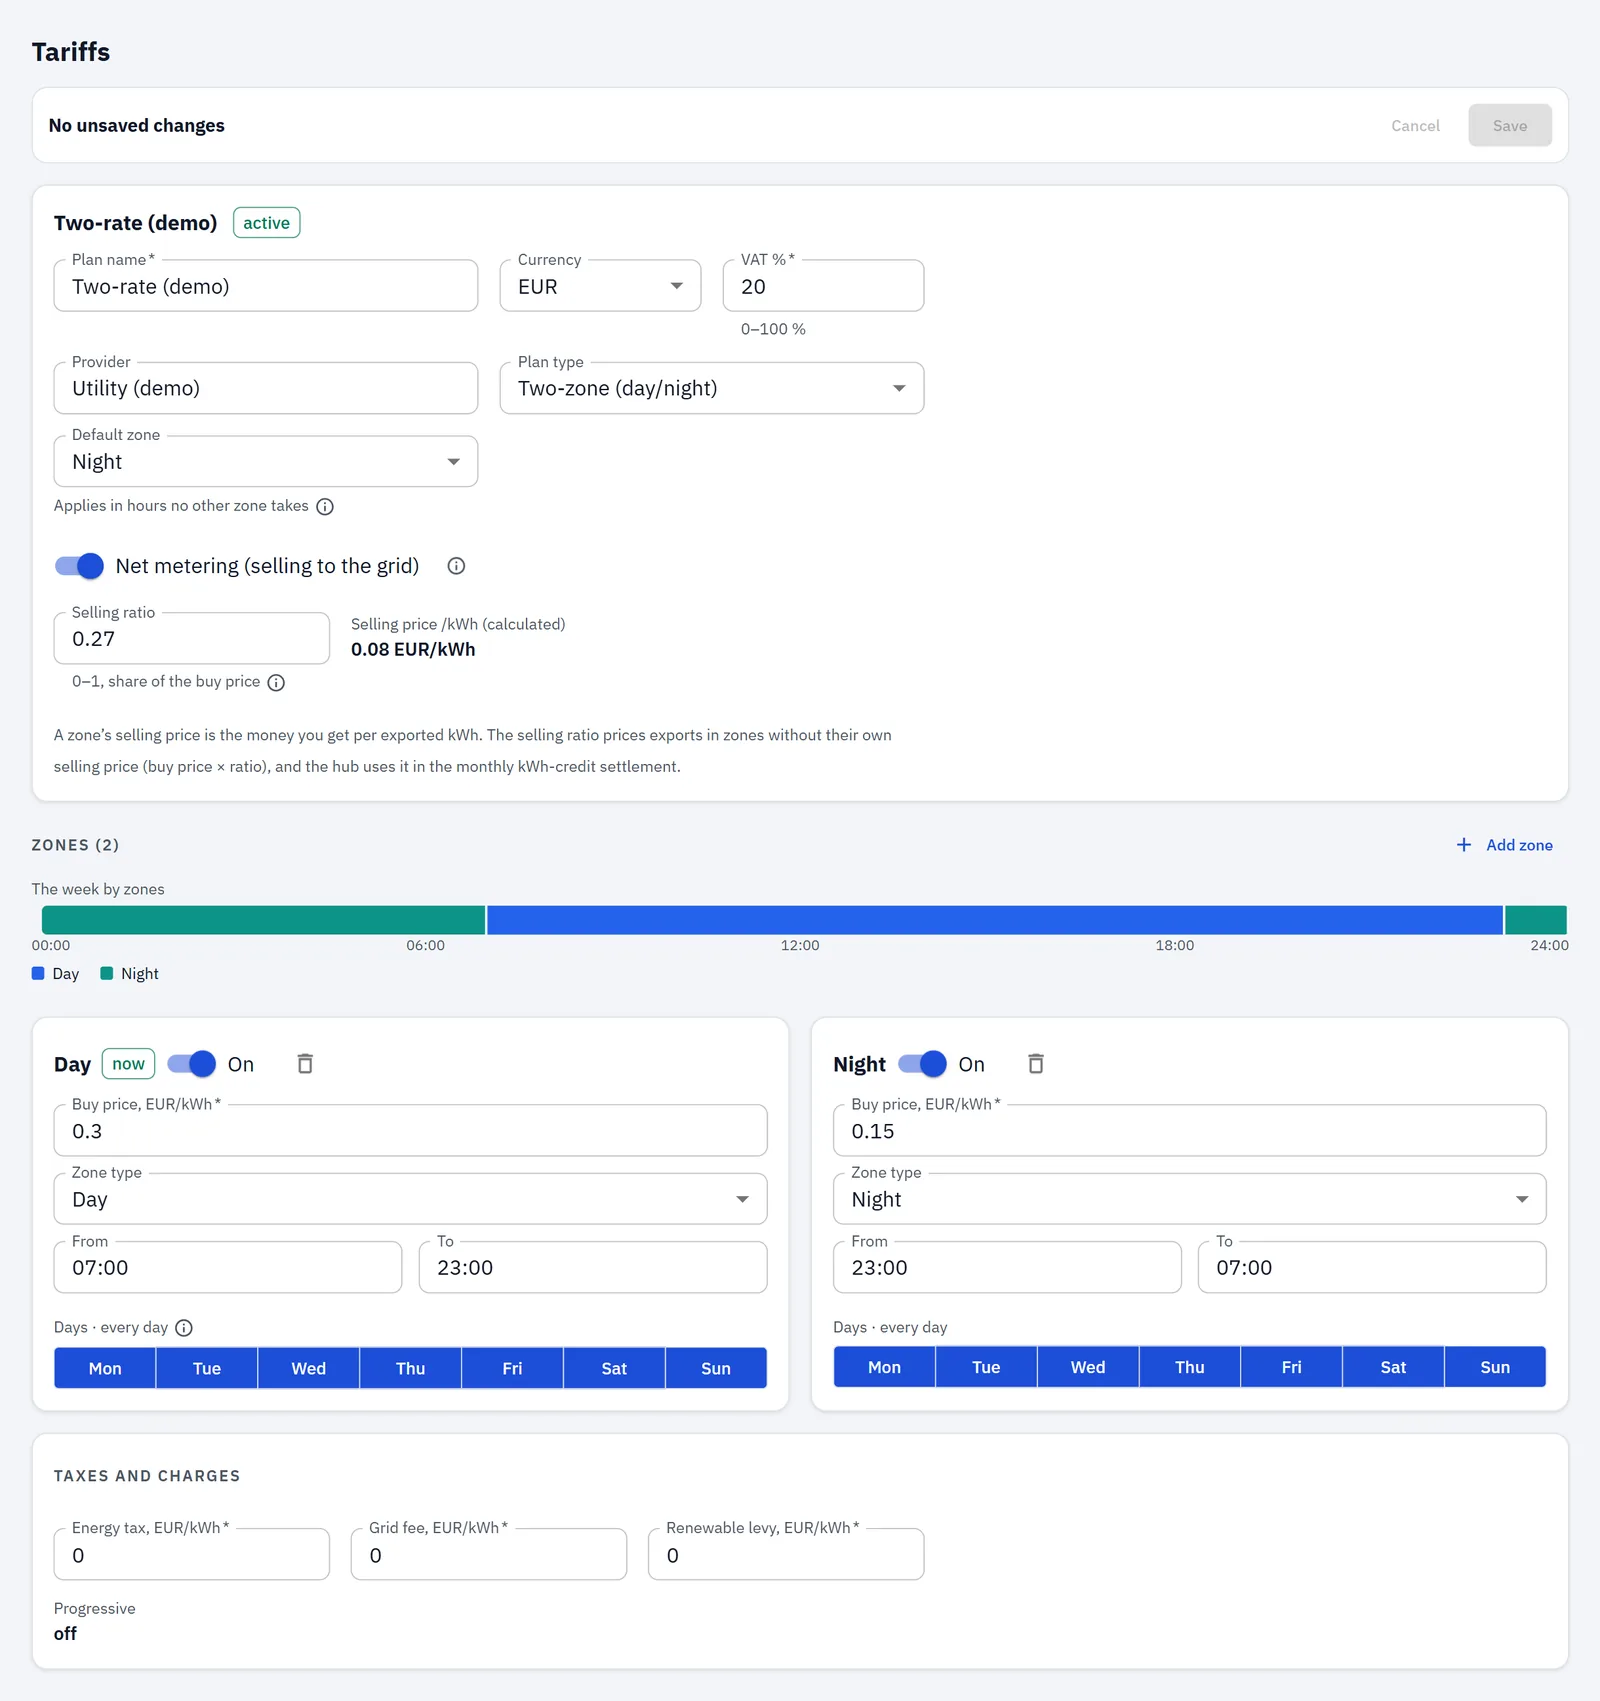
The demo's plan sets a selling ratio instead, because its zones have no sell price of their own; for your plan, use per-zone sell prices.
What each setting does:
- Export is valued at the sell price, whether net metering is on or off: exported kWh × sell price. No VAT or fees are added to it, and it isn't subtracted from the cost; the two are shown side by side.
- Net metering only adds a monthly kWh credit, shown in Economics. Switch it on only if your contract has it.
- If your contract pays nothing for export, the sell price must be 0.
The demo's plan also lists a monthly "Standing charge". Don't copy it: costs in RBgrid are energy-based, the hub doesn't include fixed charges in any cost, and the editor doesn't show them.
4. Add the solar meter and the Basic module
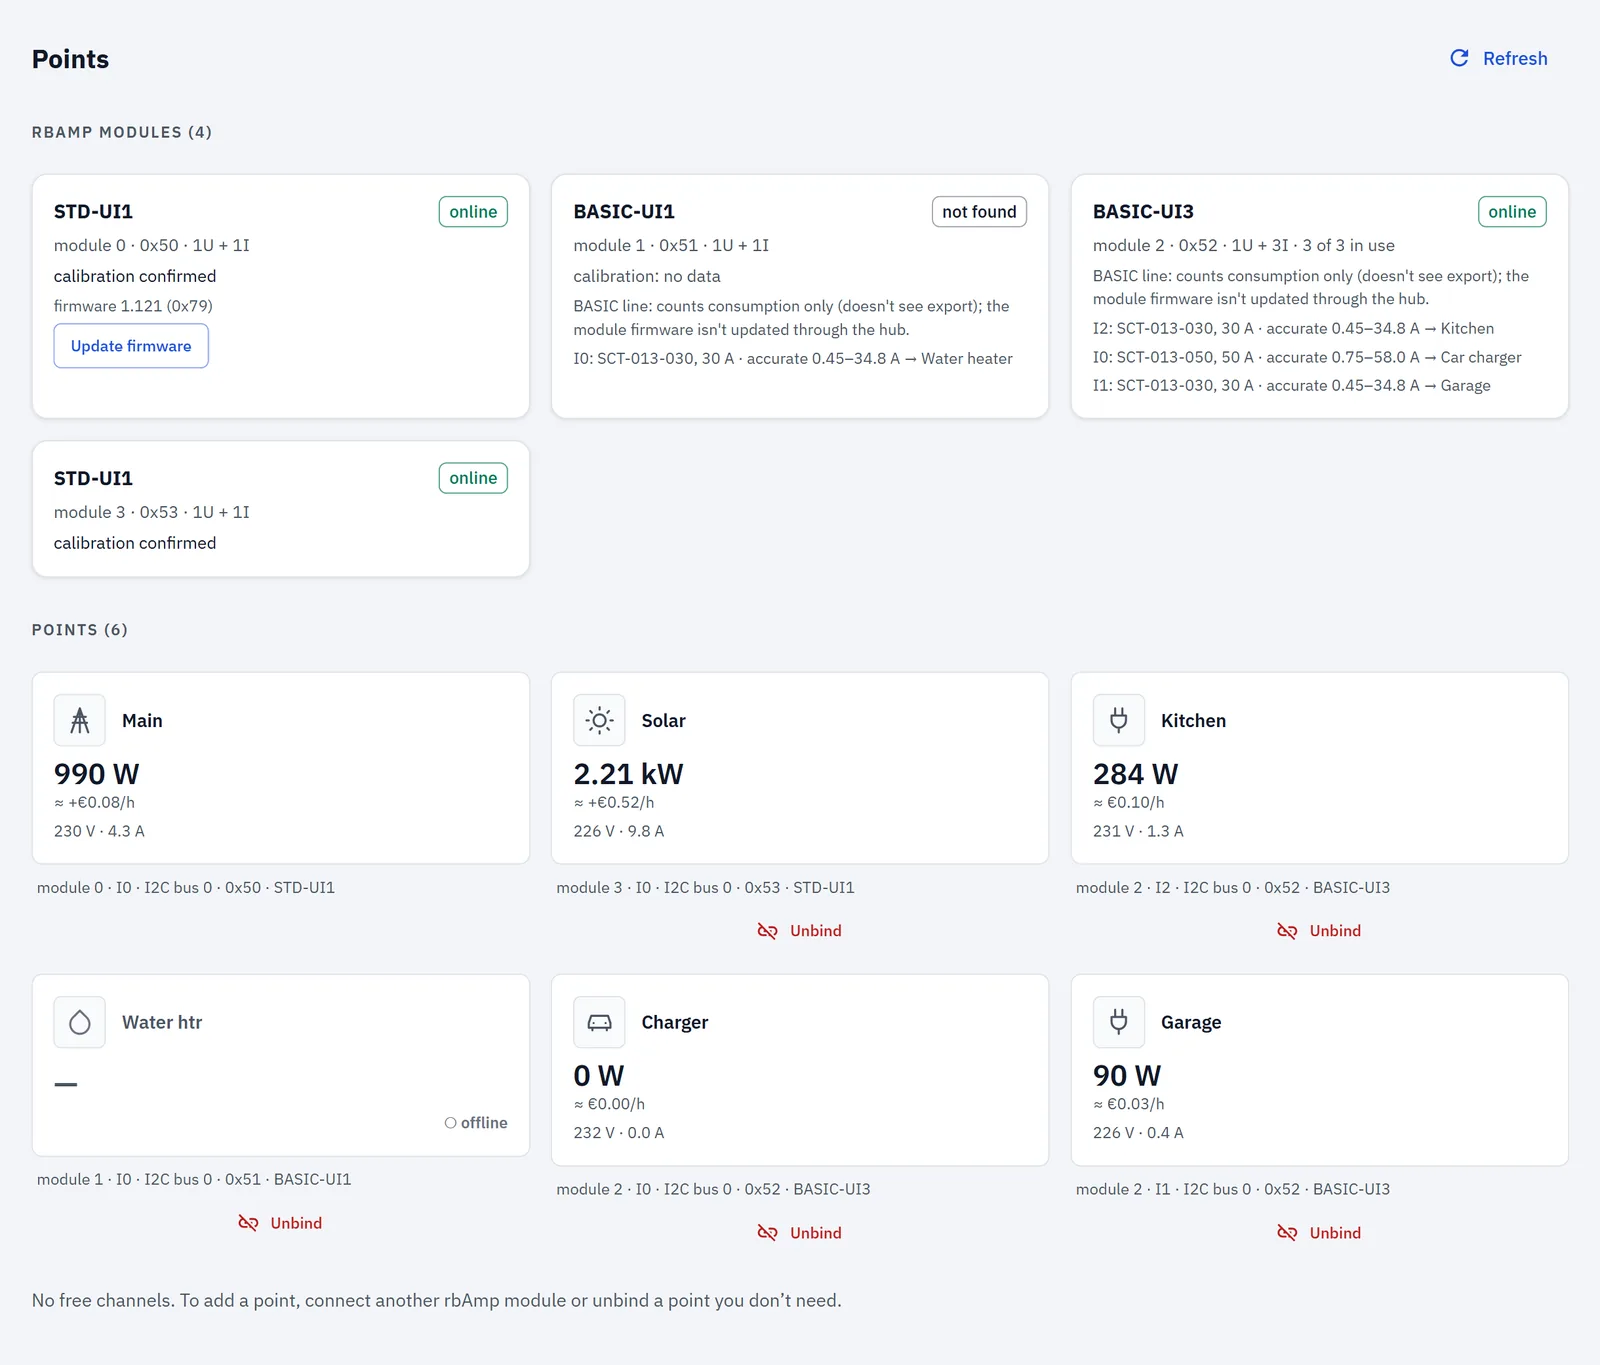
Connect the two further modules one at a time, with Points → Add a module: first the inverter line's STD-UI1, then the Basic UI5. Every module from the box answers at the same address, 0x50, so each time the app first moves the module at 0x50 to a free address. It keeps its points, history and settings. → Adding modules
For each module:
- The app offers a free address, for example 0x51, and moves the module at 0x50 there.
- Switch the hub off and connect the new module's I²C cable to the hub.
- Switch the hub on, open Add a module again and press Scan, then Add.
The new channels now show under Free sensors. Your module numbers and addresses can differ from the demo's. It doesn't matter: points are known by their names.
5. Bind the solar line and the four circuits
On the grid input, open Point setup and set:
- Input breaker, A: your main breaker (63 A in the demo);
- Input limit, kW: what your supply allows (13.8 kW in the demo). Without a contracted figure, use the breaker × 230 V.
The STD-UI1's sensor is calibrated with the module at the factory, so there's no current sensor to choose.
Group the circuits (optional). In Settings → Consumer groups → Add group, add "First floor", then Save. Leave the Group column below empty if you don't group.
Bind each free sensor with its name, role, phase and line rating. Open each new point's Point setup for the breaker, the current sensor (Basic channels only) and the group.
| Module · channel | Name | Role | Line rating | Breaker | Current sensor | Group |
|---|---|---|---|---|---|---|
| STD-UI1 (inverter) | Solar panels | Generation | 5 kW | 25 A | the module's own | — |
| Basic UI5 · I0 | Kitchen | Load | 3.68 kW | 16 A | SCT-013-020 | First floor |
| Basic UI5 · I1 | Water heater | Heating/cooling | 2.3 kW | 10 A | SCT-013-010 | First floor |
| Basic UI5 · I2 | Car charger | Charging station | 7.4 kW | 32 A | SCT-013-050 | — |
| Basic UI5 · I3 | Garage | Load | 3.68 kW | 16 A | SCT-013-020 | — |
- Line rating is what the circuit's breaker allows (16 A × 230 V = 3.68 kW).
- Role Generation marks the inverter line as production. Heating/cooling and Charging station keep the water heater and the charger out of the app's standby estimate, because they run on their own schedule.
- Phase: L1 for all, or leave it unset: the house is single-phase. Settings → Mains can stay "Not set — counted as single-phase", or choose Single phase.
- Current sensor must match the clamp actually fitted. → Points
With the car charger bound, Settings → Charging stations appears: the power above which a station counts as charging, and how long it must stay below before a session ends. The demo keeps the defaults, 500 W and 30 minutes. → Charging stations
Set the Solar point's orientation (one step, current firmware). Do it right after binding the Solar point, before the first sunny day. With the arrow from the inverter, the Solar panels point needs its orientation flag set once. The app doesn't have this switch yet, so set it over the hub's REST API. You need two things:
- the hub's address: in Settings, the Status card, "Address";
- the point's ID: the Solar panels point's page → Point setup → Technical details,
unit_id: four characters, for example0103.
From a terminal with curl:
curl -X POST http://<hub address>/api/v1/units/<point id> -H 'Content-Type: application/json' -d '{"invert_sign":true}'
In Windows PowerShell:
Invoke-RestMethod -Method Post -Uri http://<hub address>/api/v1/units/<point id> -ContentType 'application/json' -Body '{"invert_sign":true}'
If you set an API token, add -H "Authorization: Bearer <token>" to the curl command, or -Headers @{Authorization='Bearer <token>'} to the PowerShell one. It applies at once and is saved; energy counted before stays where it was. From then on, production counts as the Solar point's output: its Energy Out grows. An upcoming release does this automatically for Generation points; then this step isn't needed.
Restart the hub (Settings → Administration). A newly bound point shows live values at once and starts keeping history after the restart; nothing measured before is lost. The hub keeps history for up to 12 points; this house has six.
Check it: on the first sunny day, check on the Overview that Solar today: produced … rises while the panels produce. If it doesn't, check the Solar point's orientation flag, then the inverter line's sensor direction (turning a sensor round is work inside the panel). In the evening, switch on a load you know, such as a kettle on the kitchen circuit: its point and the supply should both rise by about its rated power.
6. What the app shows
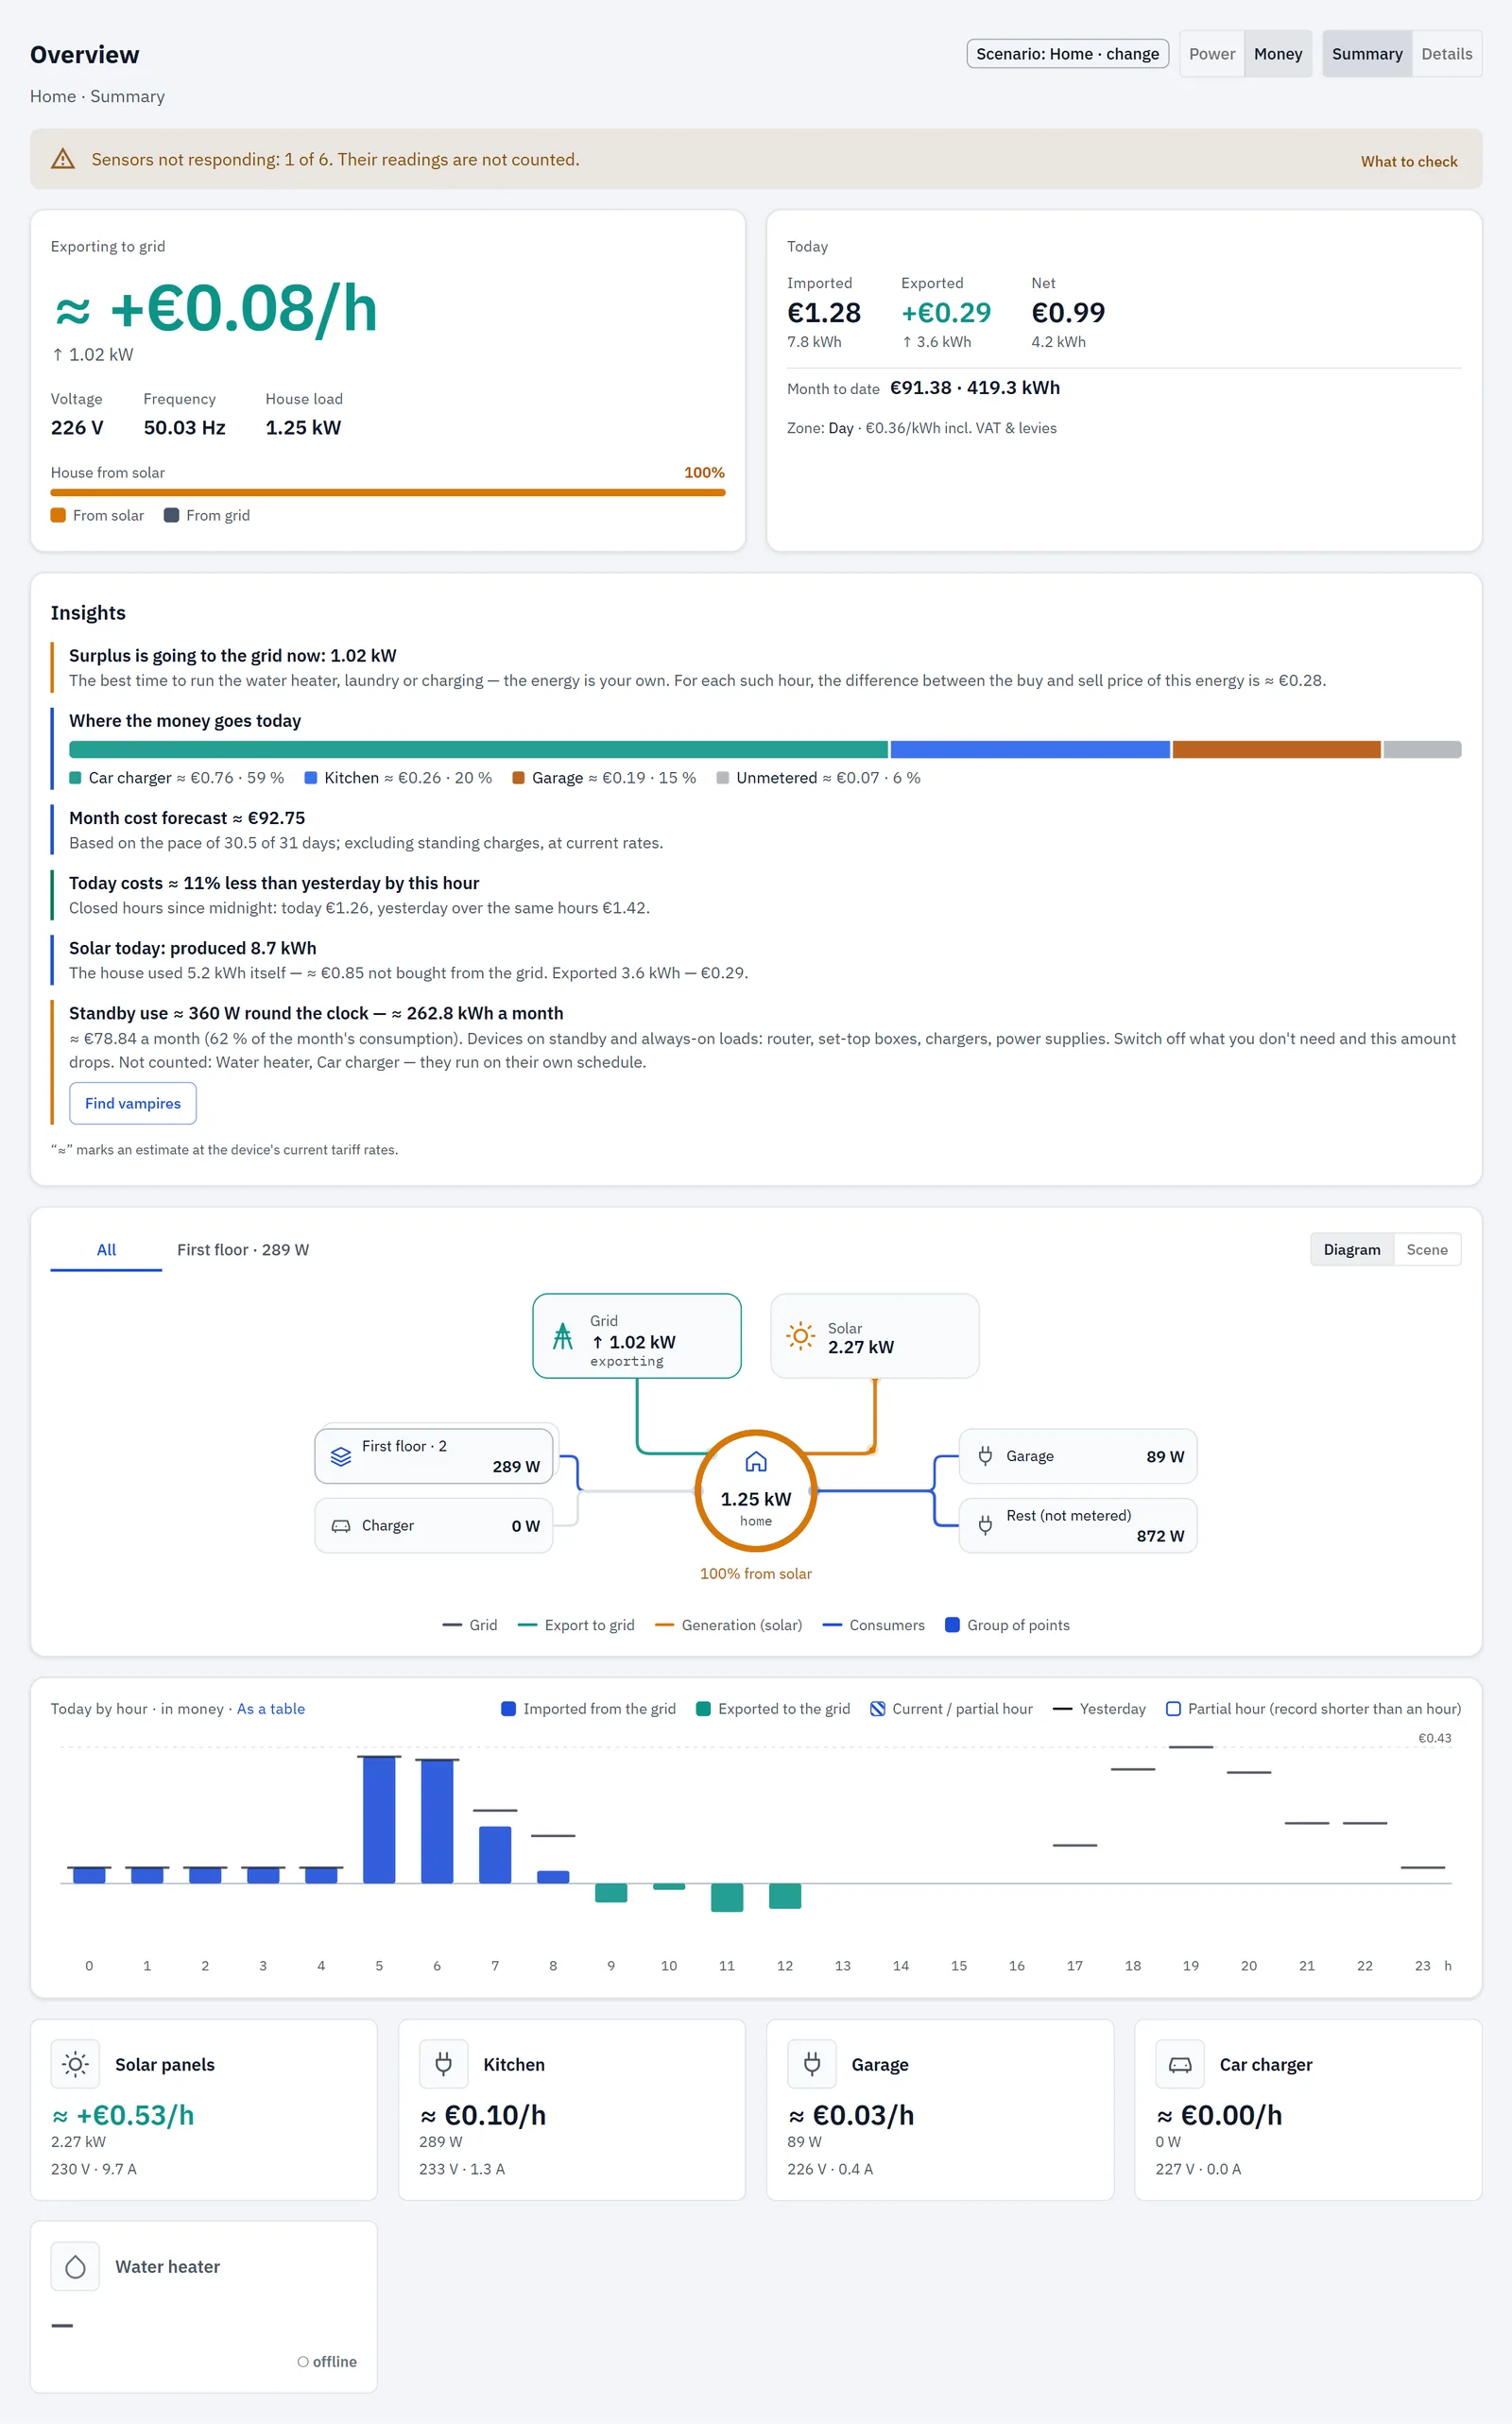
The Overview opens in money. On a sunny noon in the demo (31 October, 13:00), the solar line gives about 2.2 kW, the house uses about 1.2 kW, and the hero reads Exporting to grid, about 1.0 kW. The House from solar bar shows how much of the house's load the solar covers right now. The Today card adds Exported and Net once energy has gone out. → The Overview
Insights turns the measurements and the tariff into short notes. At that moment in the demo they read:
- Surplus is going to the grid now: 1.0 kW, with the app's suggestion that the best time to run the water heater, laundry or charging is now, and its note that for each such hour, the difference between the buy and sell price of this energy is ≈ €0.28;
- Solar today: produced 8.8 kWh, what the house used itself, and Exported 3.6 kWh — €0.29;
- Where the money goes today, Month cost forecast, and Standby use. The water heater and the car charger aren't counted in the standby figure, because they run on their own schedule.
These are the app's estimates at your current rates, marked with ≈. RBgrid doesn't switch anything on: if you run a load while the sun is out, you do it yourself. → Insights
Details adds Exported today and Self-sufficiency to the KPI row, and the Distribution chart from Solar and Grid to each load and to the grid.
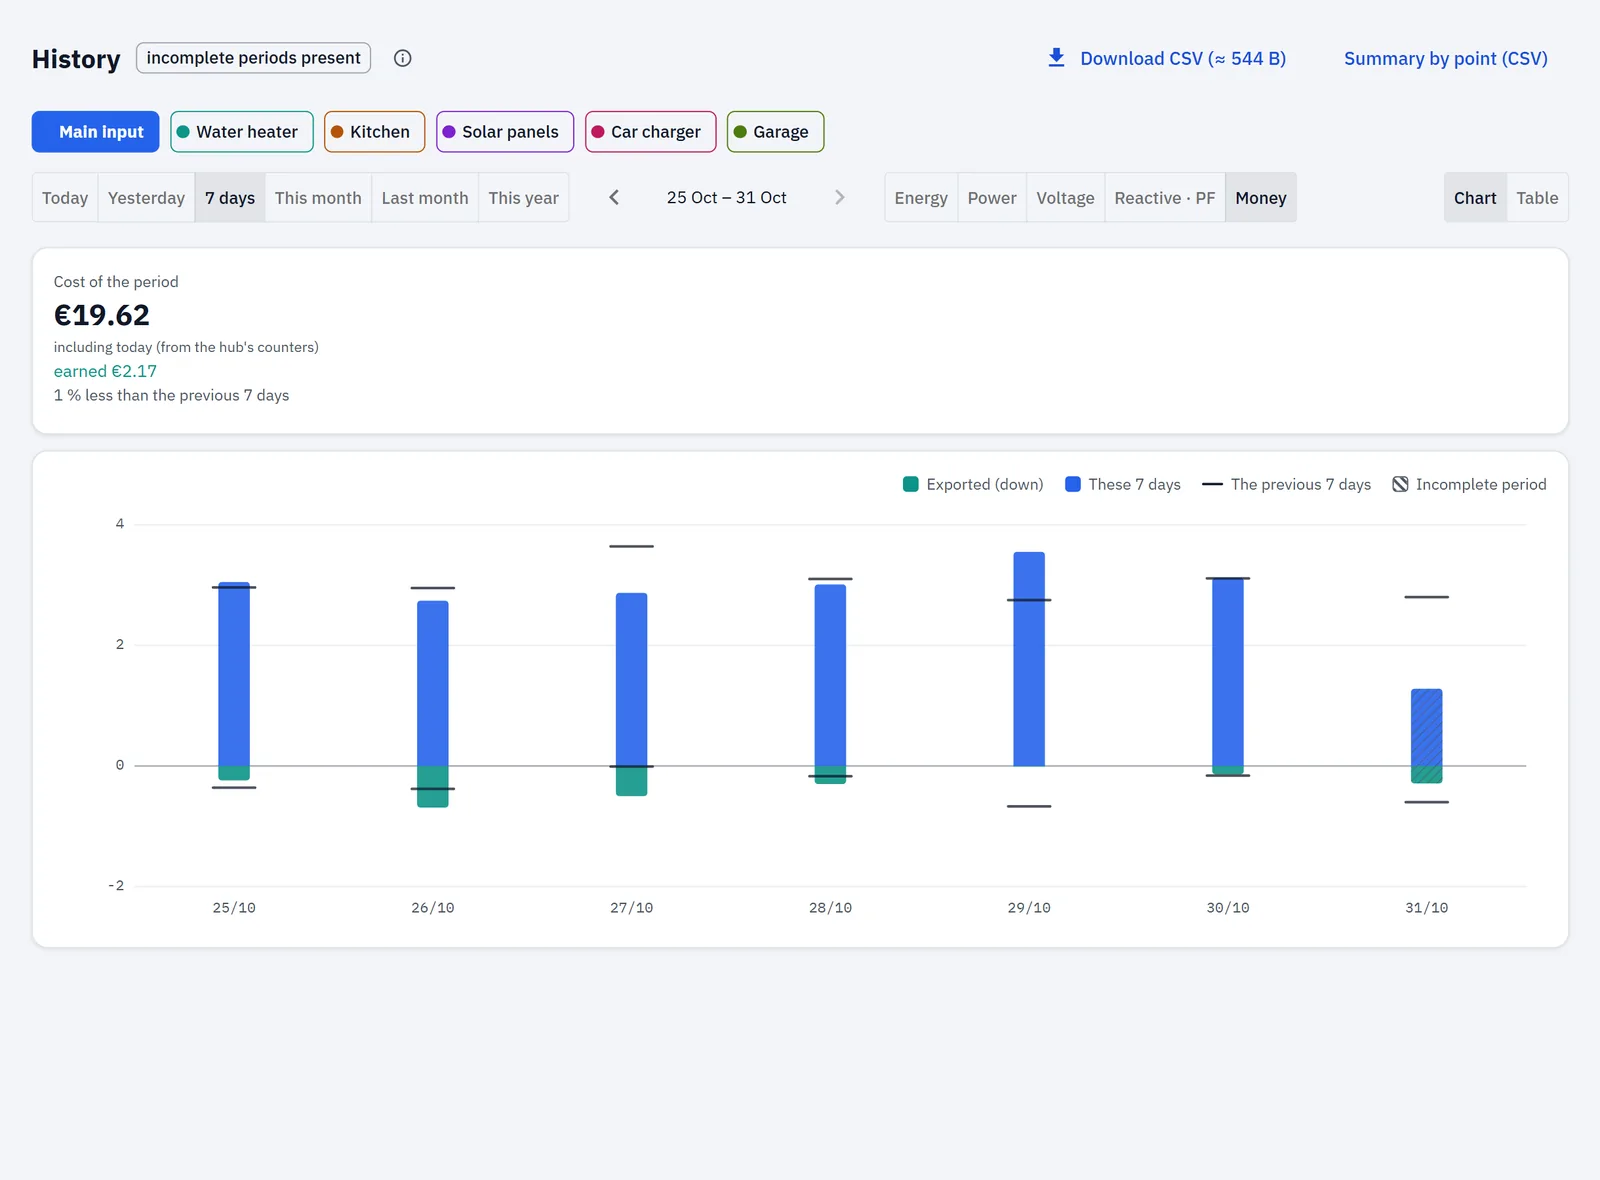
History for today, in energy, draws the supply's import upwards and its export downwards. Pick Solar panels too, and the noon export lines up with the solar curve. With 7 days, you see one sunny day after a cloudy one. → History
Economics shows, for the period you pick, the Generation block: Produced, Used on site, Not bought from the grid (an estimate at the period's average buy price), Exported with its export value, Self-consumption and Self-sufficiency. With net metering on, the Net metering — kWh credit card shows the month's credit. → Economics
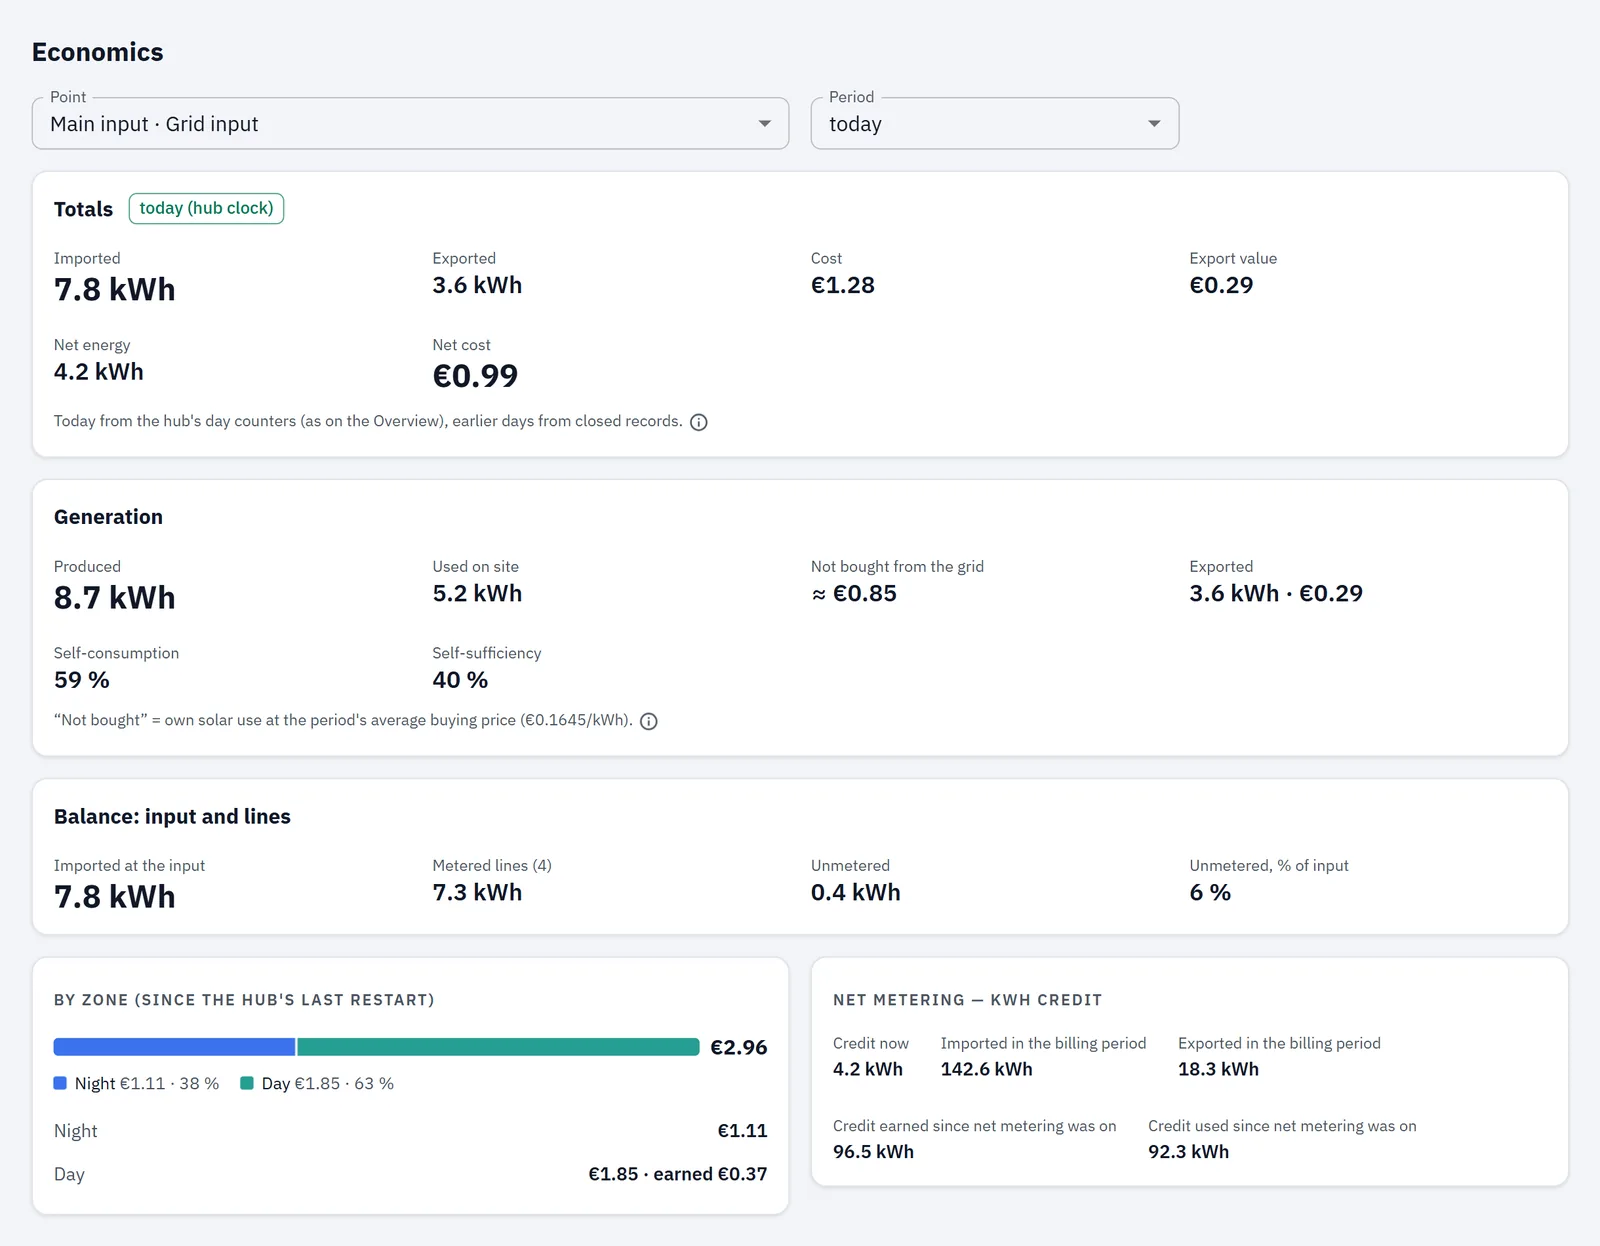
What a circuit costs with solar. Each circuit's cost is its energy at the zone's buy price, as if bought from the grid, whatever fed it at that moment. What you actually pay shows on the supply meter: grid import at the buy price, with export valued at the sell price. Not bought from the grid in Economics is the app's estimate from the supply and generation totals.
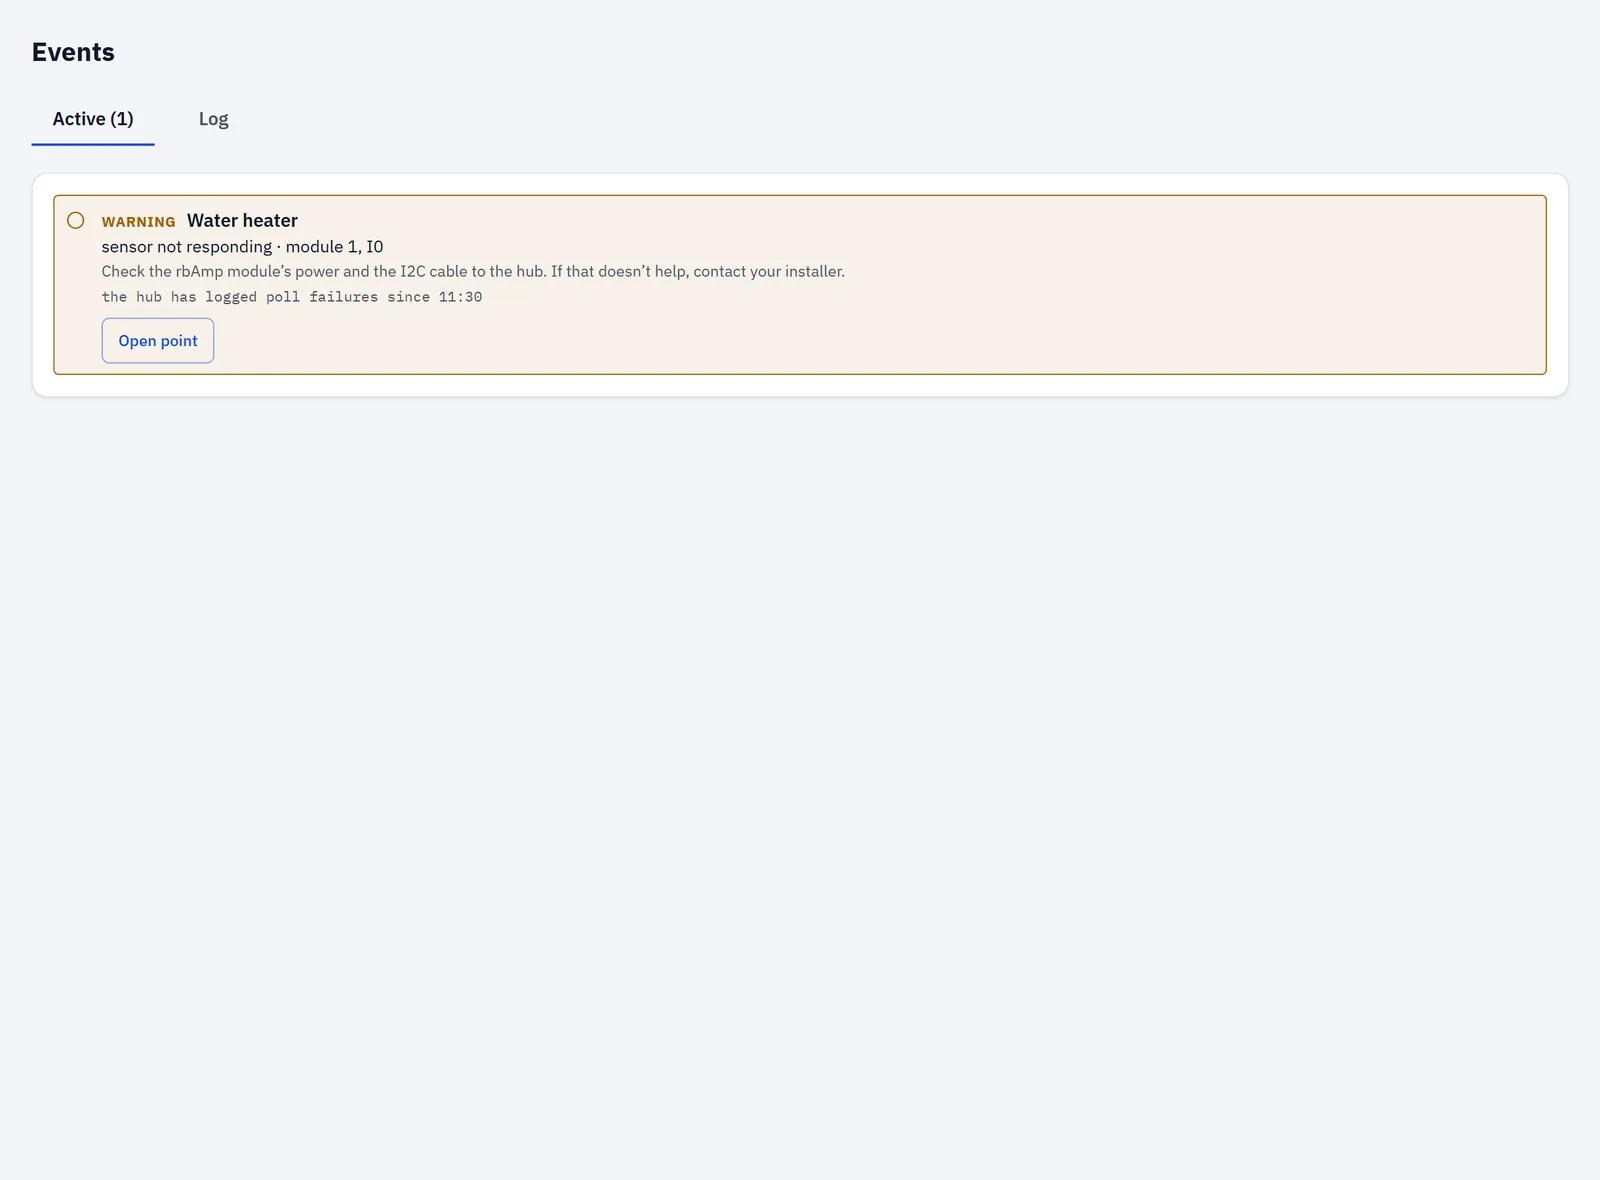
Events has one card in the demo: the water heater's module isn't answering. The card reads sensor not responding, names the module and channel, and says what to check: the module's power and the I2C cable to the hub. The Overview shows a strip, Sensors not responding: 1 of 6. Their readings are not counted. → Events
Why the supply and the solar are on STD meters
A Basic module counts one direction only: power flowing towards the load. That's fine for a kitchen or a water heater, which only ever draw. It isn't fine for the supply of a house that exports, or for the solar line.
- The supply. At noon the supply's power reverses: the house sends energy out. A Basic module on the supply wouldn't see that. The Overview couldn't say Exporting to grid, no export would be counted, and nothing would be priced at your sell price.
- The solar line. The app doesn't offer the Generation role on a Basic channel, so solar can't be bound there.
An STD meter counts both directions on the module and keeps import and export apart, so the supply shows import and export, and the inverter line is counted as production.
The sensor's direction matters too. Every sensor goes with its arrow from the source towards the consumption: on the supply from the grid into the house, on the inverter line from the inverter into the panel, on a circuit towards the load. If the supply reads export while you have no solar or battery point, the Overview says so: most often the sensor is on the wrong way round. On a Basic channel, a reversed clamp means the load isn't metered at all, and the point shows an alert.
Choosing the clamp sizes
A clamp has a range, and both ends matter:
- Too small: an SCT-013 clamp reads correctly up to about 116 % of its rating, then its readings are cut off and the circuit is under-counted. The hub flags sensor limit from about 104 % of the rating and clipping at about 116 %. A clamp rated at the circuit's breaker stays inside that range.
- Too big: on a Basic module, very small currents read as zero (below about 1.5 % of the clamp's rating), and energy below a matching threshold isn't counted.
That's why the table matches each clamp to its breaker. → Points
Known issue in app 1.1.4: the point's settings check the breaker against a limit below the clamp's rating (90 % of it), so the water heater's 10 A clamp on a 10 A breaker shows "The line breaker 10 A is above the sensor's limit (9 A)…". The clamp reads correctly at its rating; the check will be corrected in an upcoming release.
Demo data vs your house
- The demo's sun is a smooth curve from 06:00 to 20:00, times one number per day for the weather. There are no passing clouds, no seasons and no inverter limits.
- The Net metering — kWh credit card shows the same fixed figures on every demo site. They aren't this house's.
- The water heater's module failure is scripted and permanent. The demo's hub log names a different module, so the card adds that the log has no poll failure for it. On a real hub, the log names the module that went silent.
- The demo's money history leaves out VAT, and its sell price is one flat 0.08 per kWh.
- The module firmware update in the demo is simulated.
- History starts when you set the hub up; data from other systems isn't imported.
- Your numbers depend on your roof, your circuits and your prices; nothing in this guide promises a figure.
If something's wrong
- The supply reads export, but you have no solar point yet: the Overview says so; most often the supply's sensor faces the wrong way.
- "Solar today" shows no production while the sun is up: check the Solar point's orientation flag (step 5), then the inverter line's sensor and its direction (arrow from the inverter).
- Export has a value you didn't expect: check the selling price on Tariffs; exports are valued at it with net metering on or off. → Tariffs
- The orientation command answers 401: add your API token. It can't connect: check the hub address.
- A module stops answering: Events names it and says what to check. → Events
- Sensor limit or clipping on a circuit: the circuit draws more than its clamp's rating; see Choosing the clamp sizes.
Next
- Add more circuits: the Basic UI5 has one free channel; a hub takes up to eight modules, and keeps history for up to 12 points. → Sensors and modules
- Read the data into your own tools (for experienced users). Besides the CSV downloads in History, your tools can read the history of any point that keeps history (up to 12 points) over the hub's REST API:
GET /api/v1/history?unit=…&period=hour|day|week|month|year&type=energy|electrical|economics, with a read token if you set one. Or over MQTT: thecmdhistory, with the answer oncmd/resp. The MQTT commands don't check a read token yet, so use a broker with its own users. → MQTT - Read export value, net cost and the input-versus-lines balance. → Economics
- Refine the tariff: more zones, per-kWh fees. → Tariffs
- Send the data to Home Assistant: for its "Solar production", use the Solar point's Energy Out. → A power meter for Home Assistant
- Look around the finished house: demo.rbgrid.io, Home with solar