The Overview (dashboard)
The Overview is the first page of the RBgrid app. It shows what your hub measures right now and today: the power at your grid input, the power on each metered line, the phases, the day's energy and, once you've set a tariff, what that energy costs at your rates.
Every figure on the page comes from two places:
- the hub's measurements: the rbAmp modules wired to your input and your lines, read live and stored as hourly history on the hub;
- your tariff: the price plan you enter on the Tariffs page. Without a tariff the Overview shows power and energy only.
RBgrid measures. It doesn't switch or regulate any load; everything on this page is information for you to read.
The view controls
The top of the page holds the page title, an optional data delayed chip and three controls: the scenario chip, the Power / Money lens and the Summary / Details switch. The subtitle under the title repeats your choice, for example "Home · Summary".
Site scenario: Home, Business or Charging stations
The chip reads Scenario: Home · change. Click it to choose how the Overview is laid out:
| Scenario | What the Summary view focuses on |
|---|---|
| Home | Where the energy comes from and what it costs: grid input, solar, home circuits. |
| Business | Phases, circuits against their rating, the attention list and a single-line diagram. |
| Charging stations | How much the stations charge and whether the grid input has enough capacity. |
The scenario is a hub setting: it changes the Overview for everyone who opens this hub, and it applies at once, without a restart. The app asks you to confirm and offers three buttons:
- Change: writes the scenario to the hub. This needs the API token if you've set one.
- Just preview: shows the layout in this browser only. A banner then reads Preview: "Business" — this browser only. The hub shows "Home". Press Back to end the preview.
- Cancel.
If the hub doesn't answer, the app uses the last scenario it knew, or Home.
The scenario changes three things:
- the layout of the Summary view (the Details view is the same for all three);
- the lens the page opens with the first time (see below);
- the wording of the Insights (Business uses business phrasing, for example "base load outside working hours" instead of "standby use").
Power / Money lens
With a tariff set, the Power | Money switch chooses which figure leads on the cards:
- Power leads with watts and kilowatt-hours; the cost is the small line underneath.
- Money leads with the cost in your tariff's currency; the power or energy is the small line.
The flow diagrams always stay in kW. Limits, headroom, phase currents, voltage and frequency always stay physical units.
Your choice is remembered in this browser, for this hub; it isn't a hub setting. Until you choose, Home and Charging stations open in Money and Business opens in Power.
Without a tariff the switch is hidden and the page stays in Power.
How the money figures are worked out
Money values marked ≈ are the app's estimates at your current rates. The day's import cost and export value on the Today card come from the hub's own counters.
| What | How the app values it |
|---|---|
| Live power you import | power × your buy rate, shown as "≈ 0.12 €/h" |
| Live power you export | power × your sell rate (no sell rate set: 0) |
| Solar generation | the part your home uses itself × buy rate + the part exported × sell rate |
| A day's energy without a hub cost total | energy × today's average price at your input (or the current buy rate) |
The buy rate is the hub's all-in rate when it reports one; otherwise the app takes the current zone's rate, adds the per-kWh energy tax, grid fee and renewable levy from your plan, and applies VAT. The sell rate is the one in your plan. See Tariffs.
Summary / Details
- Summary is the scenario's at-a-glance layout.
- Details shows the same analytical set for every scenario: a KPI row, phases, the hourly chart with the attention list, Insights and the tariff ribbon, the energy-flow diagram and a table of all points.
The choice is kept while this browser tab stays open; a new tab starts on Summary.
The "data delayed" chip
data delayed appears next to the title when the hub's live frames arrive with gaps (some frames were skipped). The figures are still real, but they may lag a few seconds behind.
Cards by scenario
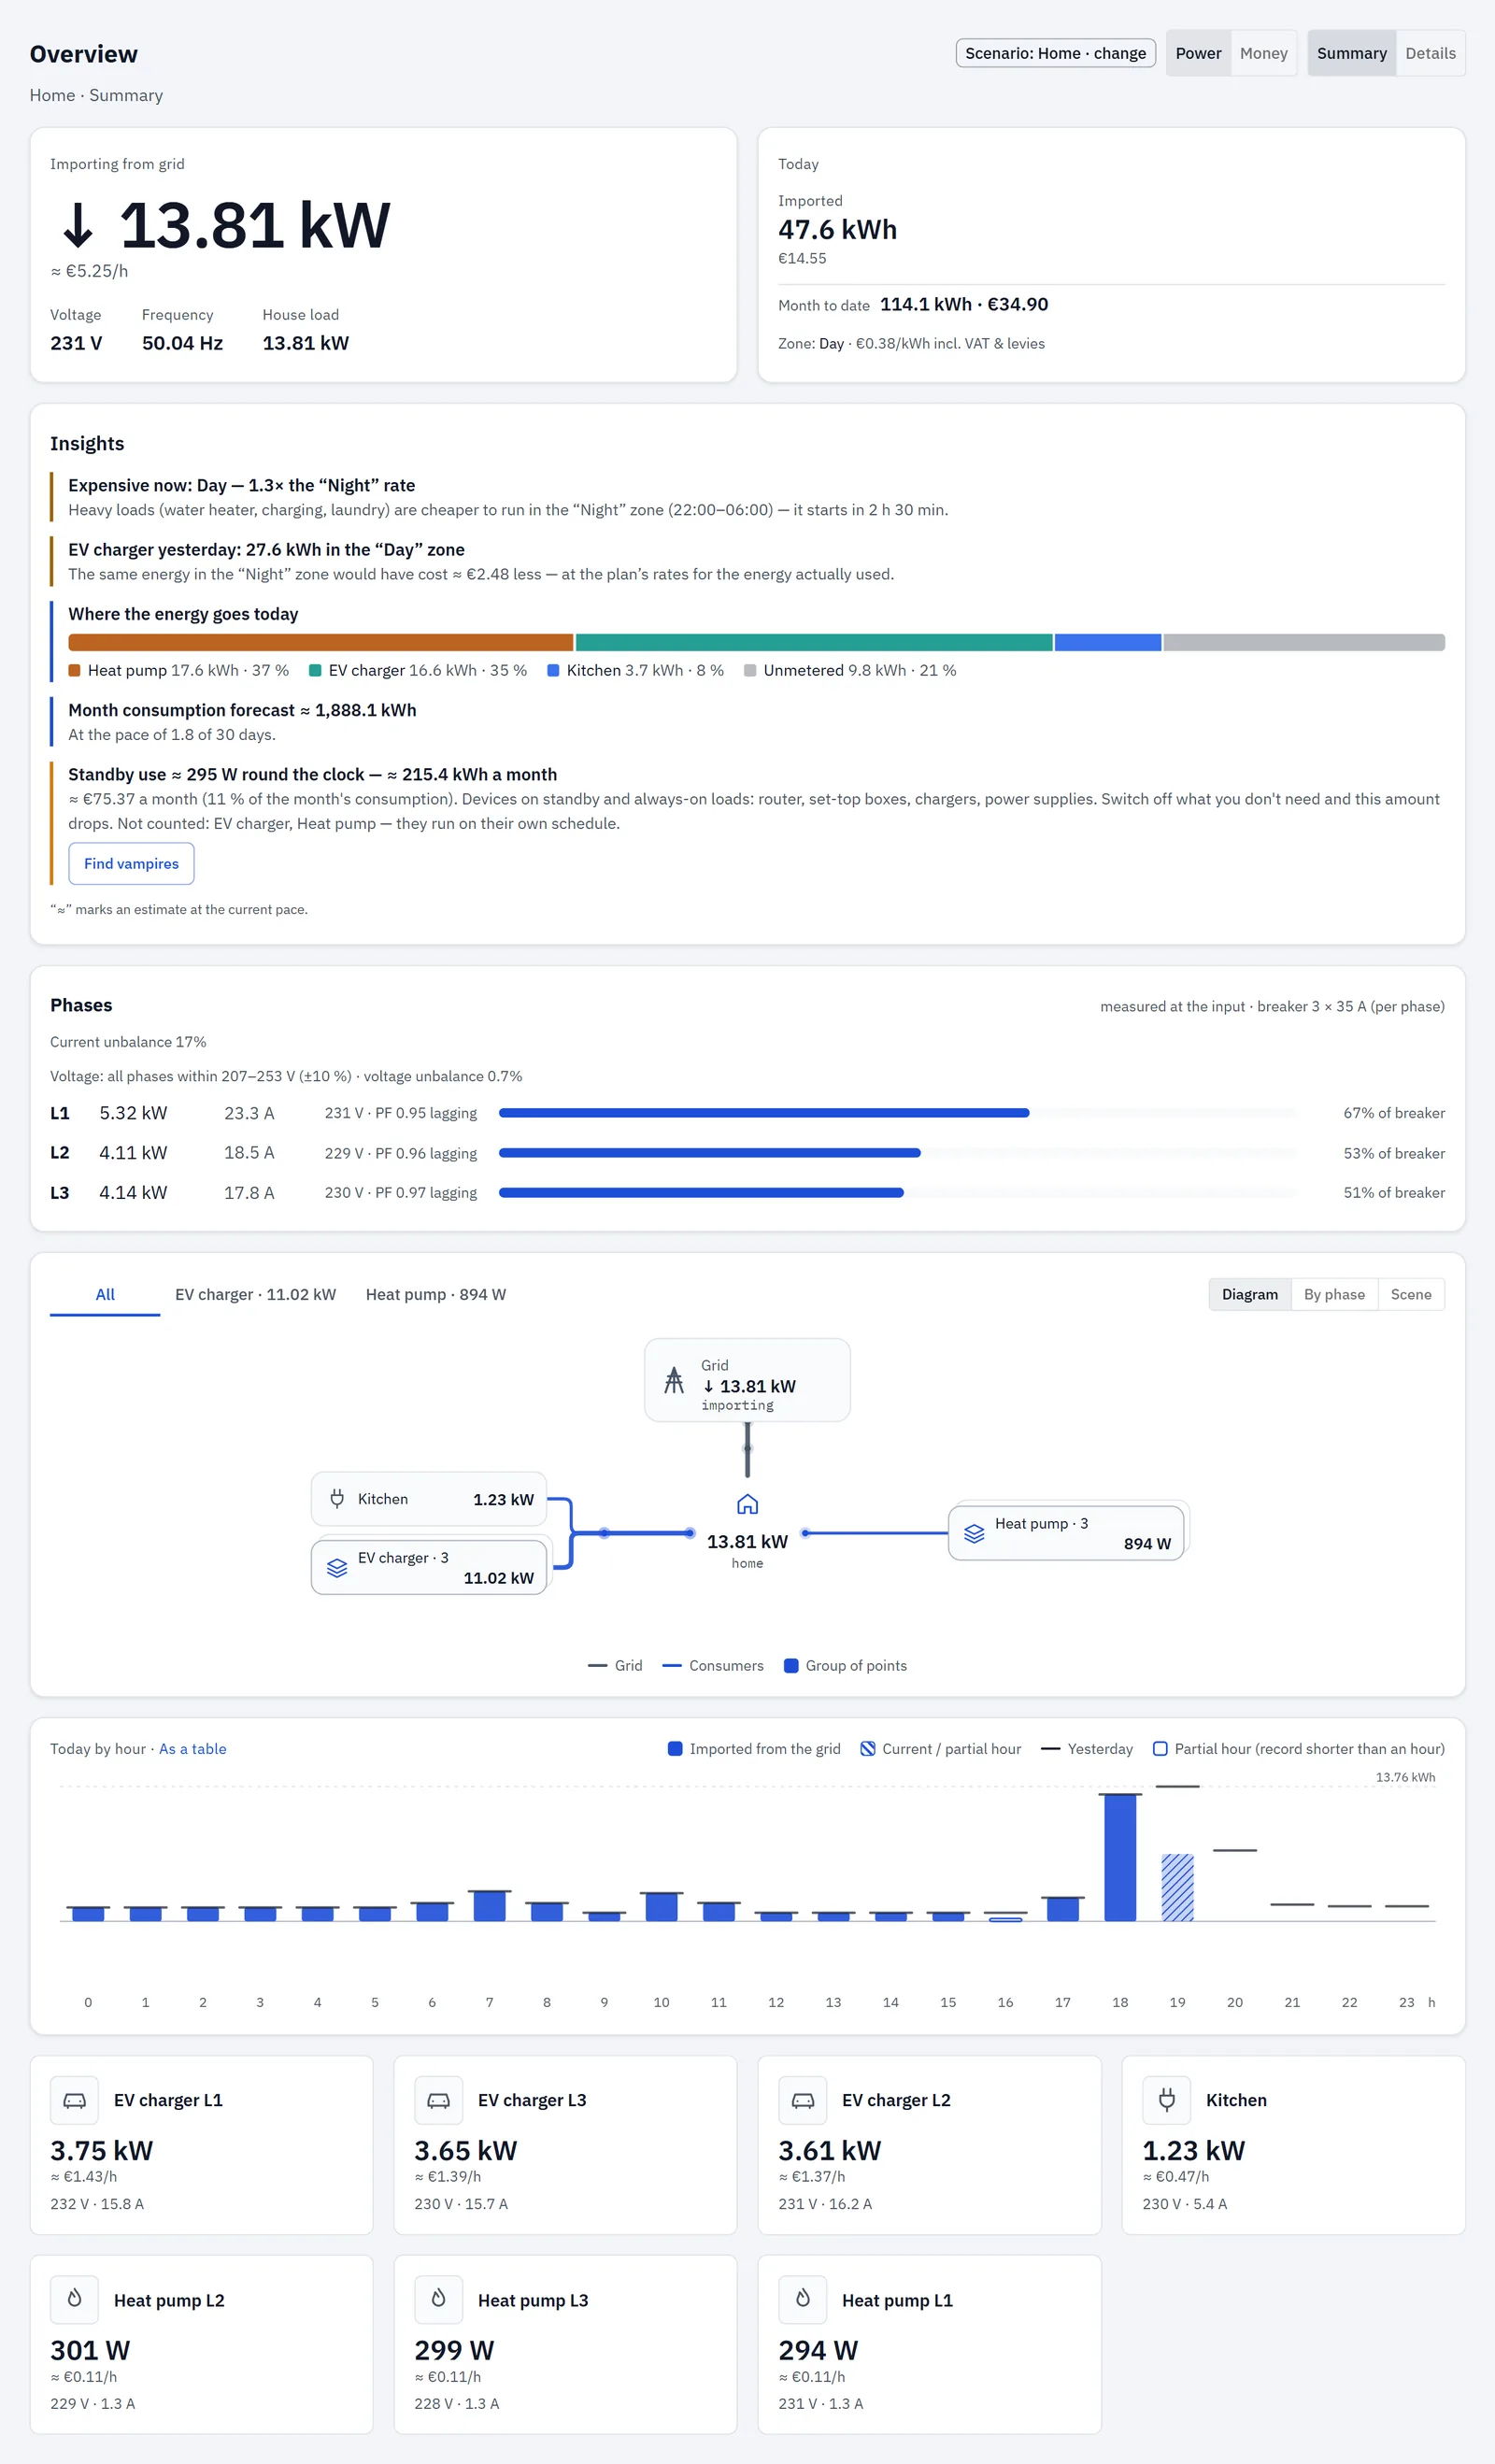
Home: Summary
In order:
- Power hero and Today, side by side on a wide screen.
- Insights, when a tariff is set.
- Phases, when your mains is multi-phase.
- Energy flow (diagram, by phase or scene).
- Today by hour chart.
- Point tiles, one per metered line.
If the connection drops, the top row dims until it's back.
Power hero
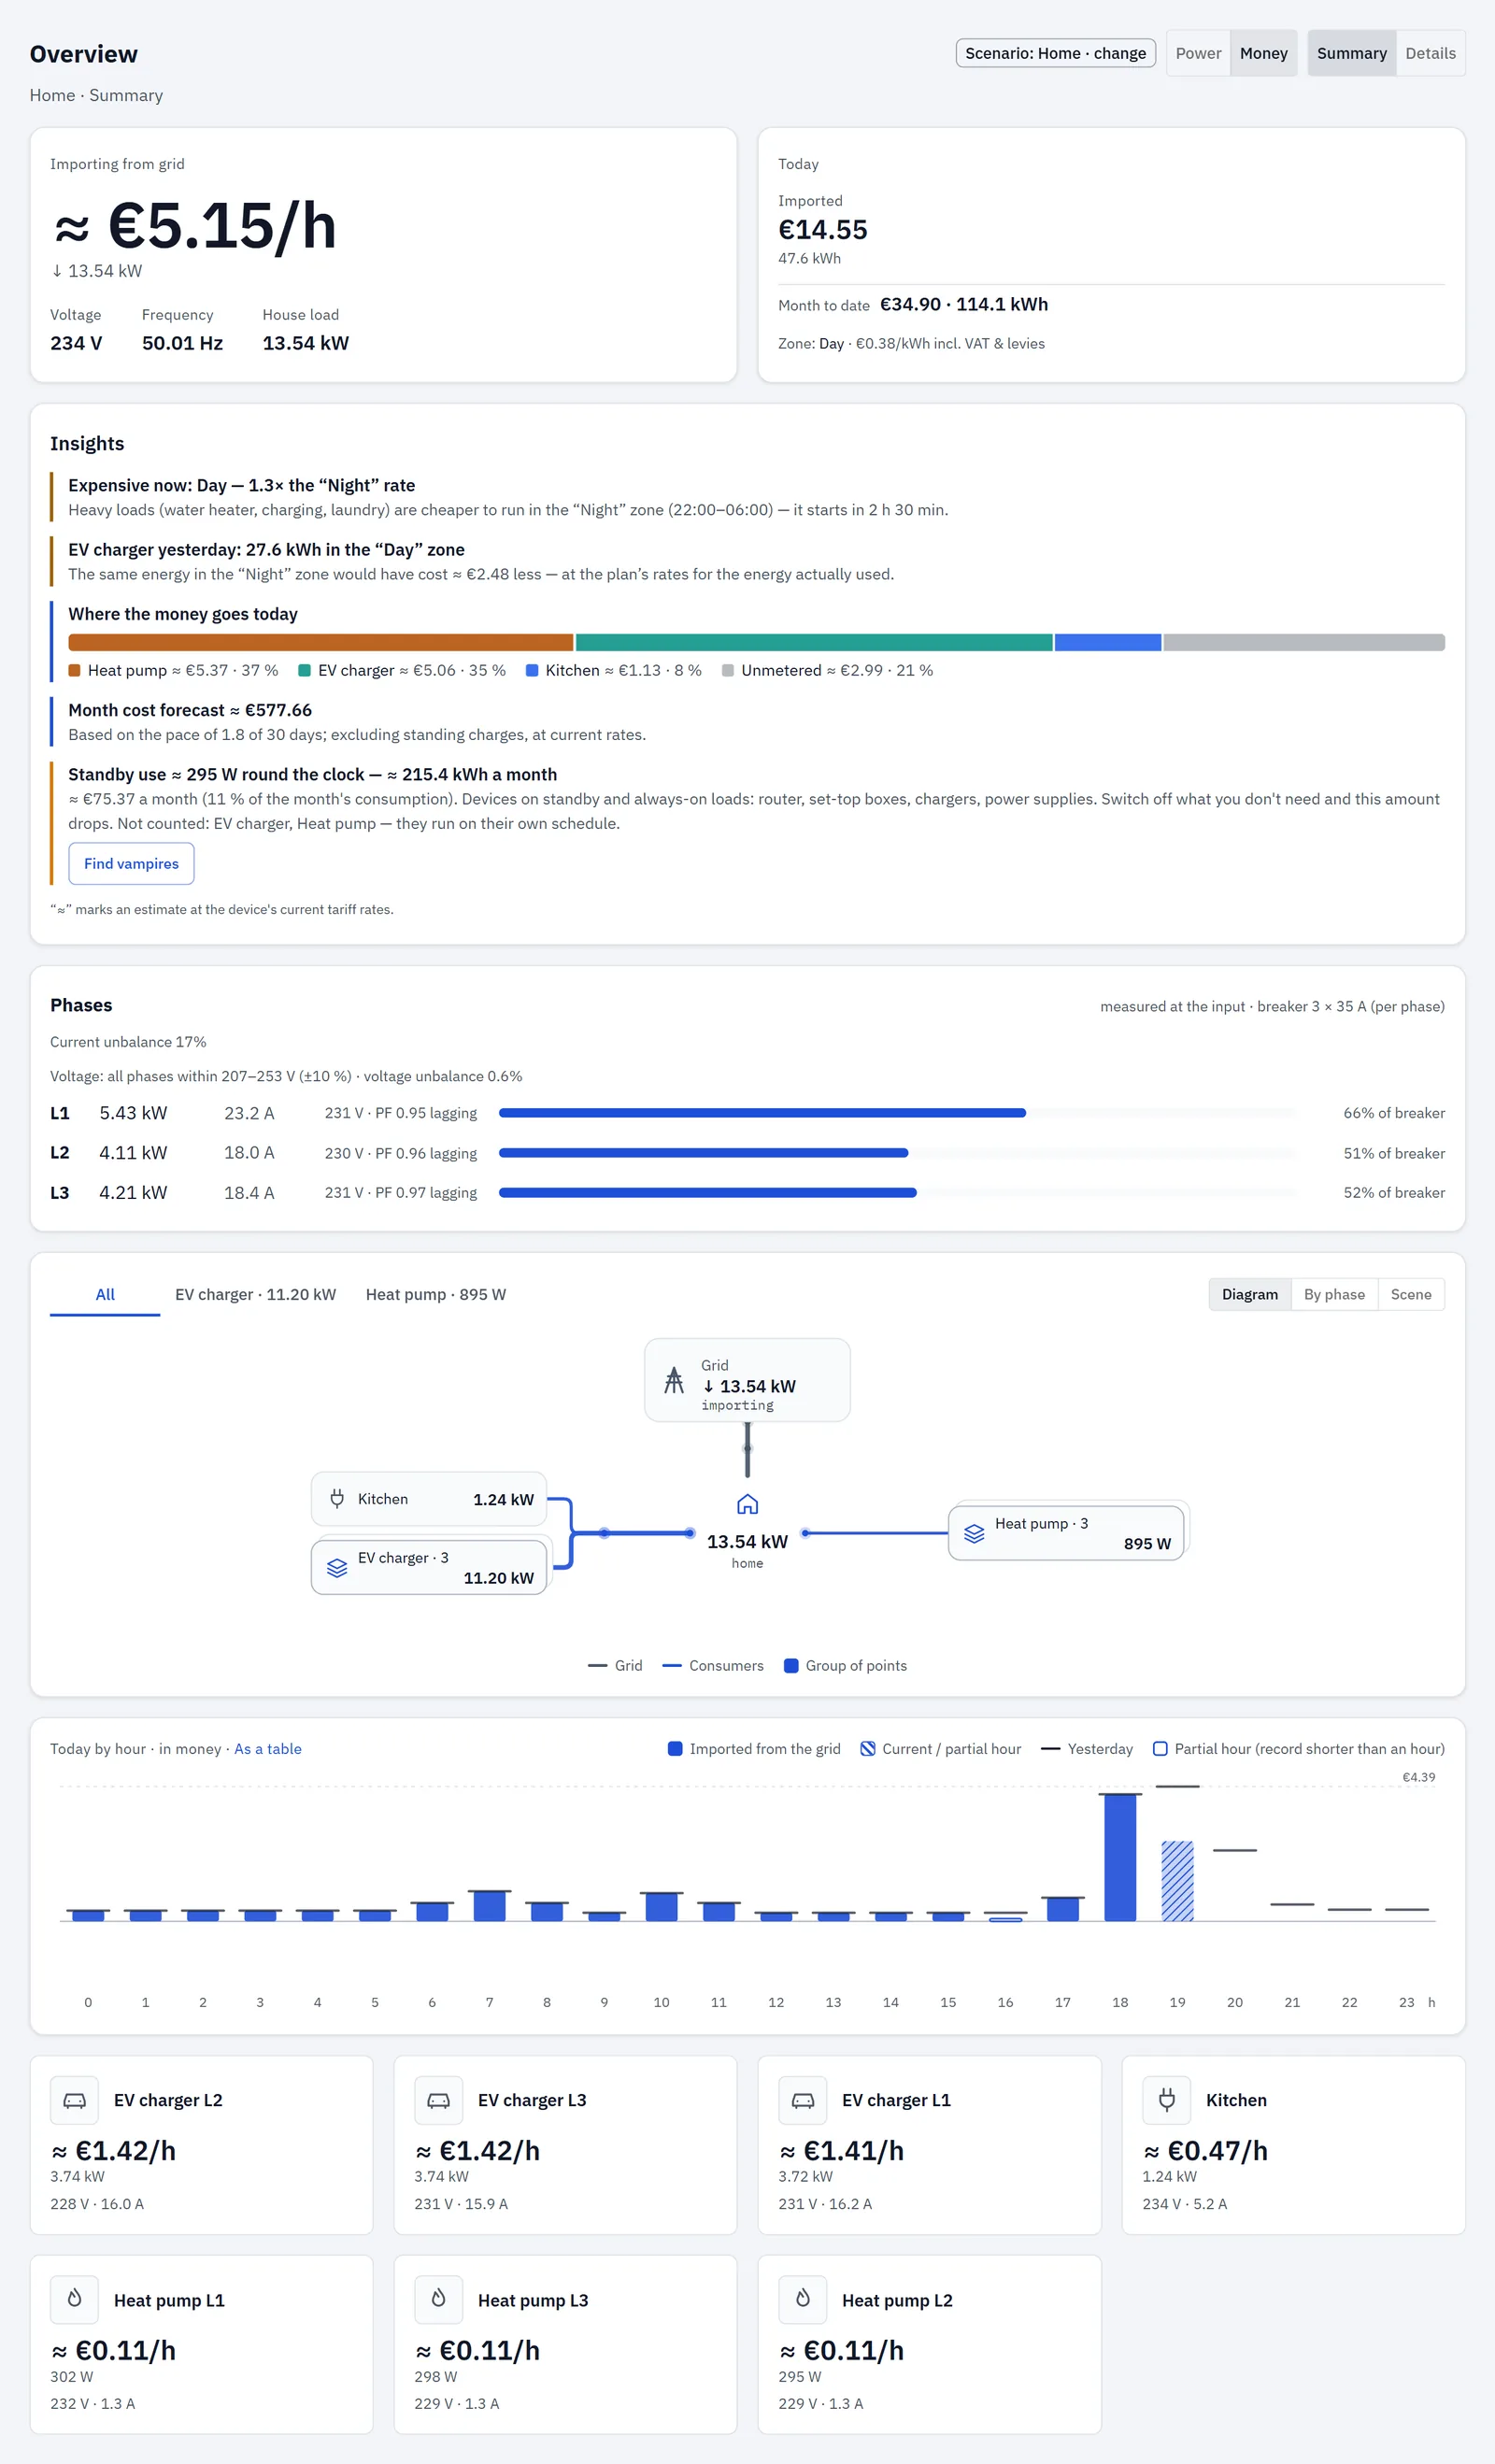
The big figure is the power at your grid input right now, with an arrow: ↓ importing from the grid, ↑ exporting to it. In Money mode the hourly cost (≈ €/h) leads and the power is under it.
The label tells you the state:
| Label | Meaning |
|---|---|
| Importing from grid / Exporting to grid | The input module measures the direction. |
| Grid input now | The input doesn't report a direction. |
| Input · no flow | The power is too small to tell from zero (twice the input's resolution, or 0.5 W). |
| Input · no data | No input point, or it isn't answering. |
| … · held 12 s | The hub hasn't had a new reading for that long; the last value is shown greyed. |
Below the figure:
- Voltage: from the input, the voltage module, or the average of the input's phases; per-phase values (L1, L2, L3) underneath when a voltage module reports them.
- Frequency: only when something on the site measures it; otherwise "—".
- House load: what your home uses now (see Energy flow); "—" when it can't be known.
- House from solar: with a solar (generation) point and a directional input, a bar shows what share of the house load comes from solar and what from the grid.
Two checks can appear here:
- The input reads export to the grid, but there is no generation or storage on site… — the input shows more than 5 W of export and you have no solar or battery point. Most often the input's current sensor is clamped the wrong way round, or the point has the wrong role.
- The phases' power sign disagrees with the input total… — the phases and the total point in opposite directions (both above 50 W). Check the direction of the phase current sensors.
Today
The Today card shows the day so far:
- Imported: energy from the grid, and its cost from the hub's own cost counter.
- Exported: shown once at least 10 Wh went out; its value from the hub's export counter.
- Net: imported minus exported, in energy and money. Shown together with Exported only.
- Month to date: the closed days of this month from the hub's history plus today.
- The current zone and rate, for example "Zone: night · 0.18 €/kWh incl. VAT & levies". With no tariff the line isn't shown.
"Today" means the hub's day. If the hub's clock isn't set, a note says that "today" counts from the hub's last midnight or restart, not your calendar day. Set the clock on the Time page.
If money is still counted with the factory example tariff, the card says so and links to Set your tariff →, which opens the setup wizard.
If the hub reports a cost of 0 next to real energy, the app treats the cost as unknown and shows its own estimate (≈ energy × rate) instead of 0.00.
Point tiles
One tile per metered line (the input and the voltage module aren't tiles), the ones answering first, then by power. Each tile shows an icon guessed from the point's name, the name, its power (Money mode: ≈ cost per hour) and its voltage and current. Click a tile to open that point (see Points).
A status word appears only when something deviates: offline, no such channel on the module, clipping, sensor limit, or sensor reversed — not metered for a basic module wired backwards.
A ≈ before a line's power means it's an estimate: a multi-phase line measured with one current sensor is multiplied by the number of its conductors.
Business: Summary
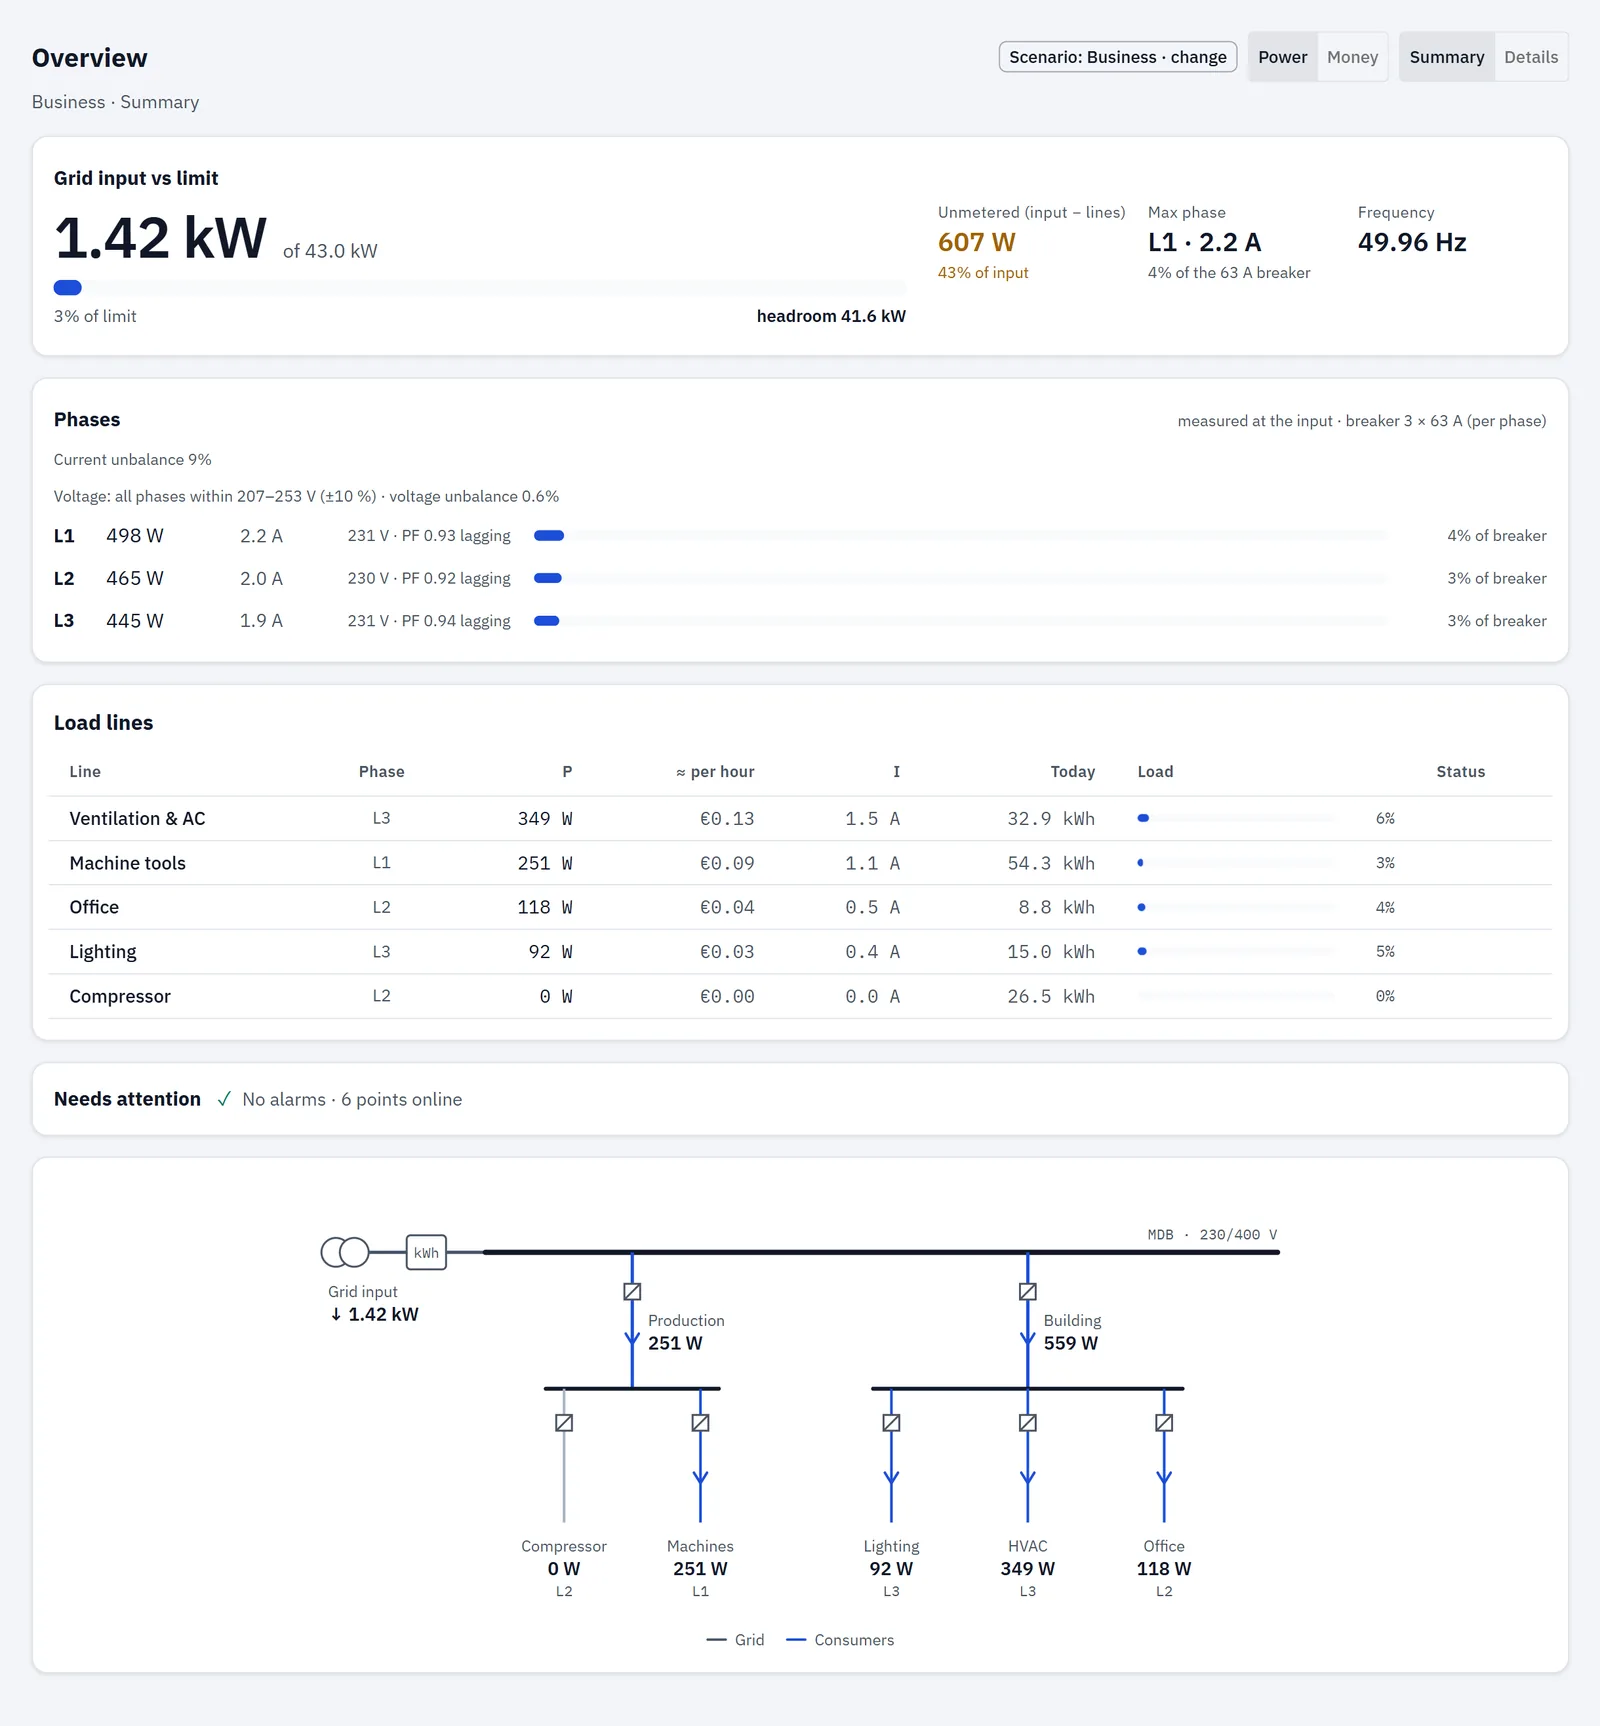
In order:
- Grid input vs limit hero.
- Phases: shown when the input reports phases, or when your lines are assigned to phases (then "estimated from lines").
- Load lines table and the Needs attention panel. On a phone the panel moves above the table when a point is offline.
- Single-line diagram.
The Business Summary has no Insights card, no tiles and no hourly chart; those are under Details.
Grid input vs limit
The big figure is the input power against your input limit, with a bar, "{pct}% of limit" and the headroom left. Above 92 % the bar is marked near limit, above 100 % above limit.
The limit is the smaller of two values from the input point's settings: its rated power, and what its breaker passes (amps × nominal voltage × number of conductors, 230 V if no nominal voltage is set).
- With only one of the two set, that one is the limit.
- With neither set, the card says: "Input limit is not set — set the input's rated power to see load and headroom."
- When the rated power is less than half of what the breaker passes, the card asks whether that's intended (a contracted capacity) or a single-phase figure, with a Check link.
Side figures:
- Unmetered (input − lines): the input minus all metered lines (solar lowers it). Highlighted above 10 % of the input; unknown when any line is offline.
- Max phase: the most loaded phase and its share of the breaker (above 80 % "high", above 100 % "overload"). When phases are estimated from lines and more than 20 % is unmetered, it reads "at least" (≥).
- Frequency.
Load lines
One row per line: Line, Phase, P, ≈ per hour (with a tariff; first in Money mode), I, Today (output for generation, import for the others), Load and Status.
Load is the line's power against its rated power. The status appears only on a deviation: offline, no such channel on the module, clipping, sensor limit, high (above 80 % of rating) or above limit (above 100 %). Generation lines have no load status.
Needs attention
When all is well: Needs attention ✓ No alarms · 12 points online.
Otherwise a list, with the count in the header and "{n} of {m} online" at the bottom. Each row links to its point:
| Row text | Tag | Meaning |
|---|---|---|
| "current clipped by the sensor ({pct} % of rating) · under-metered" | clipping | The current reached the sensor's range; the real value is higher than shown. |
| "{power} — {pct} % of the line's rating" | above rating | The line draws more than its rated power (not checked on the input and generation). |
| "near the sensor limit ({pct} % of rating)" | sensor limit | The current is close to the sensor's range. |
| "no new data for {s} s — the last value is shown" | held | The hub has had no new reading for that long. |
| "sensor not responding" | offline | The sensor isn't responding. |
Single-line diagram
A one-line drawing of your installation: the input (transformer and meter), the main bus, then the switchboards and their lines. Switchboards are your point groups; lines without a group sit under MDB. Solar appears as a second feed into the bus. A label like "≈ L1L2L3" marks a multi-phase line estimated from one sensor.
Charging stations: Summary
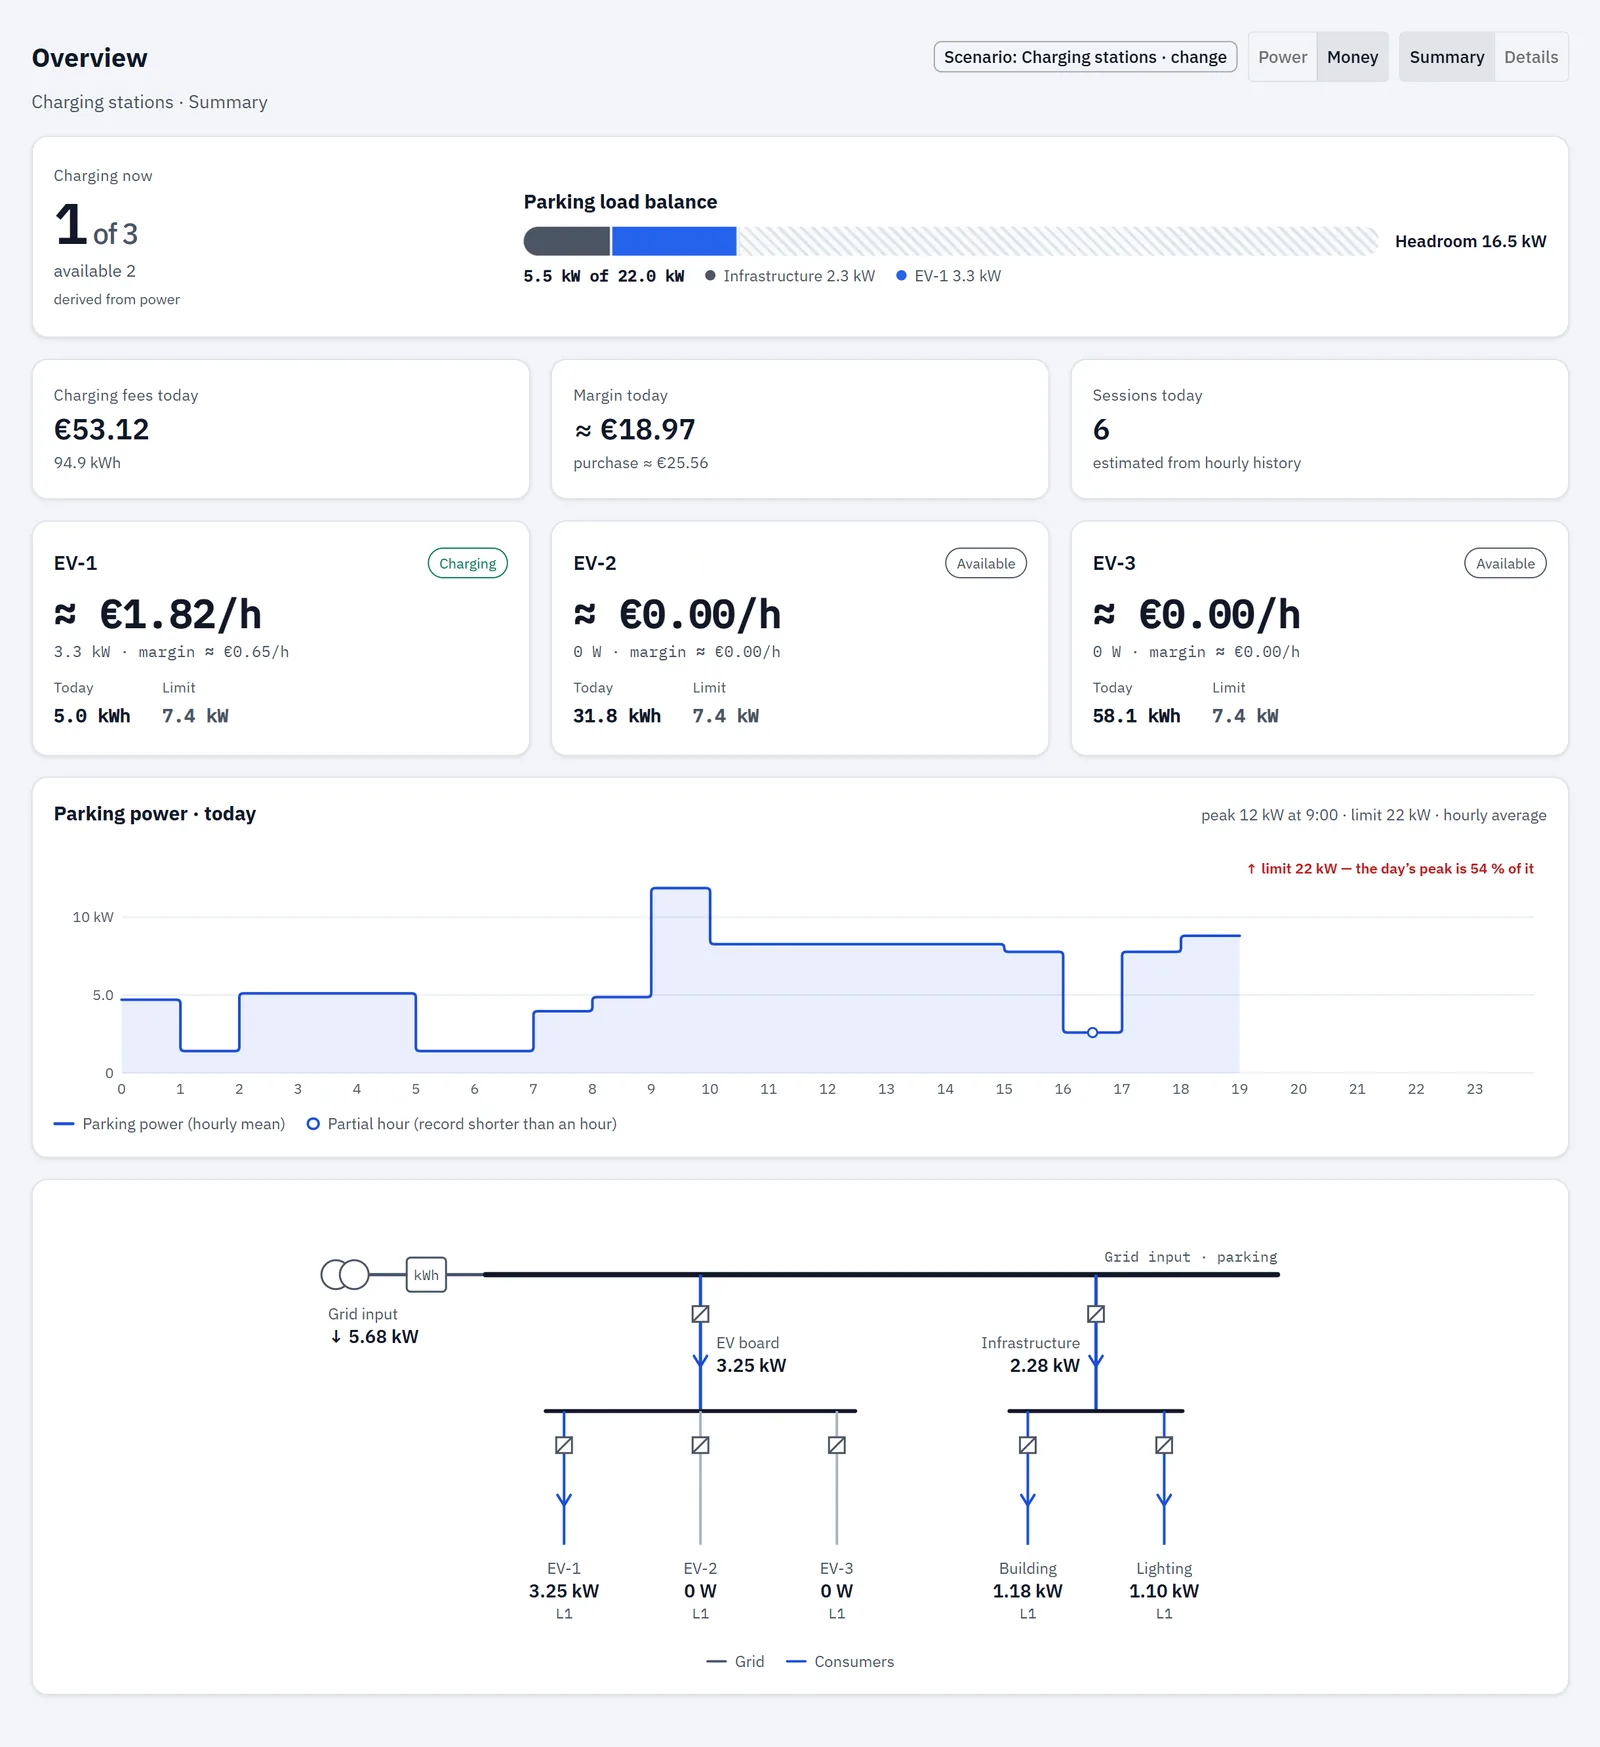
A station is a point with the EV-charging role (or, without a role, a point whose ID starts with "ev."). With no stations the page says: "No charging stations found among the metering points."
In order:
- Parking hero.
- KPI row.
- Station cards.
- Parking power · today chart.
- Single-line diagram, split into "EV board" and "Infrastructure".
There's no Insights card in this scenario's Summary.
Station status
RBgrid measures the power on each station's line, not the connector state, so the status is derived from power:
| Status | When |
|---|---|
| Charging | The line draws more than the charging threshold (500 W unless the hub or the station sets another value). |
| Available | The station answers and draws less than the threshold. |
| Offline | The station's sensor isn't answering. |
Parking hero
- Charging now: "3 of 8", plus how many are available and offline.
- Parking load balance: a bar of the input limit filled with the site's other loads ("Infrastructure") and one segment per station, and the headroom left. At 92 % of the limit or more it reads "At the limit · stations draw {pct}% of the power".
The limit comes from the input point's settings. Without it, the card asks you to set it.
KPI row
- In Power mode, or with no sale price: Energy today (all stations together) and Charging fees today (at the sale price, when one is set).
- In Money mode with a sale price per kWh: Charging fees today leads, with the energy underneath, then Margin today ≈ fees − the energy at your buy rate.
- Sessions today, estimated from the hourly history; or Charging now when there's no history to count from.
Station cards
Each card: name, status, power now, energy Today and the station's Limit (its rated power). In Money mode with a sale price: ≈ fees per hour and ≈ margin per hour at the current power.
Parking power · today
Hourly average power of the parking lines, with the day's peak and its hour, and the limit line. With more than 8 parking lines (or none) it shows the grid input instead, titled "· from grid input".
Details (all scenarios)
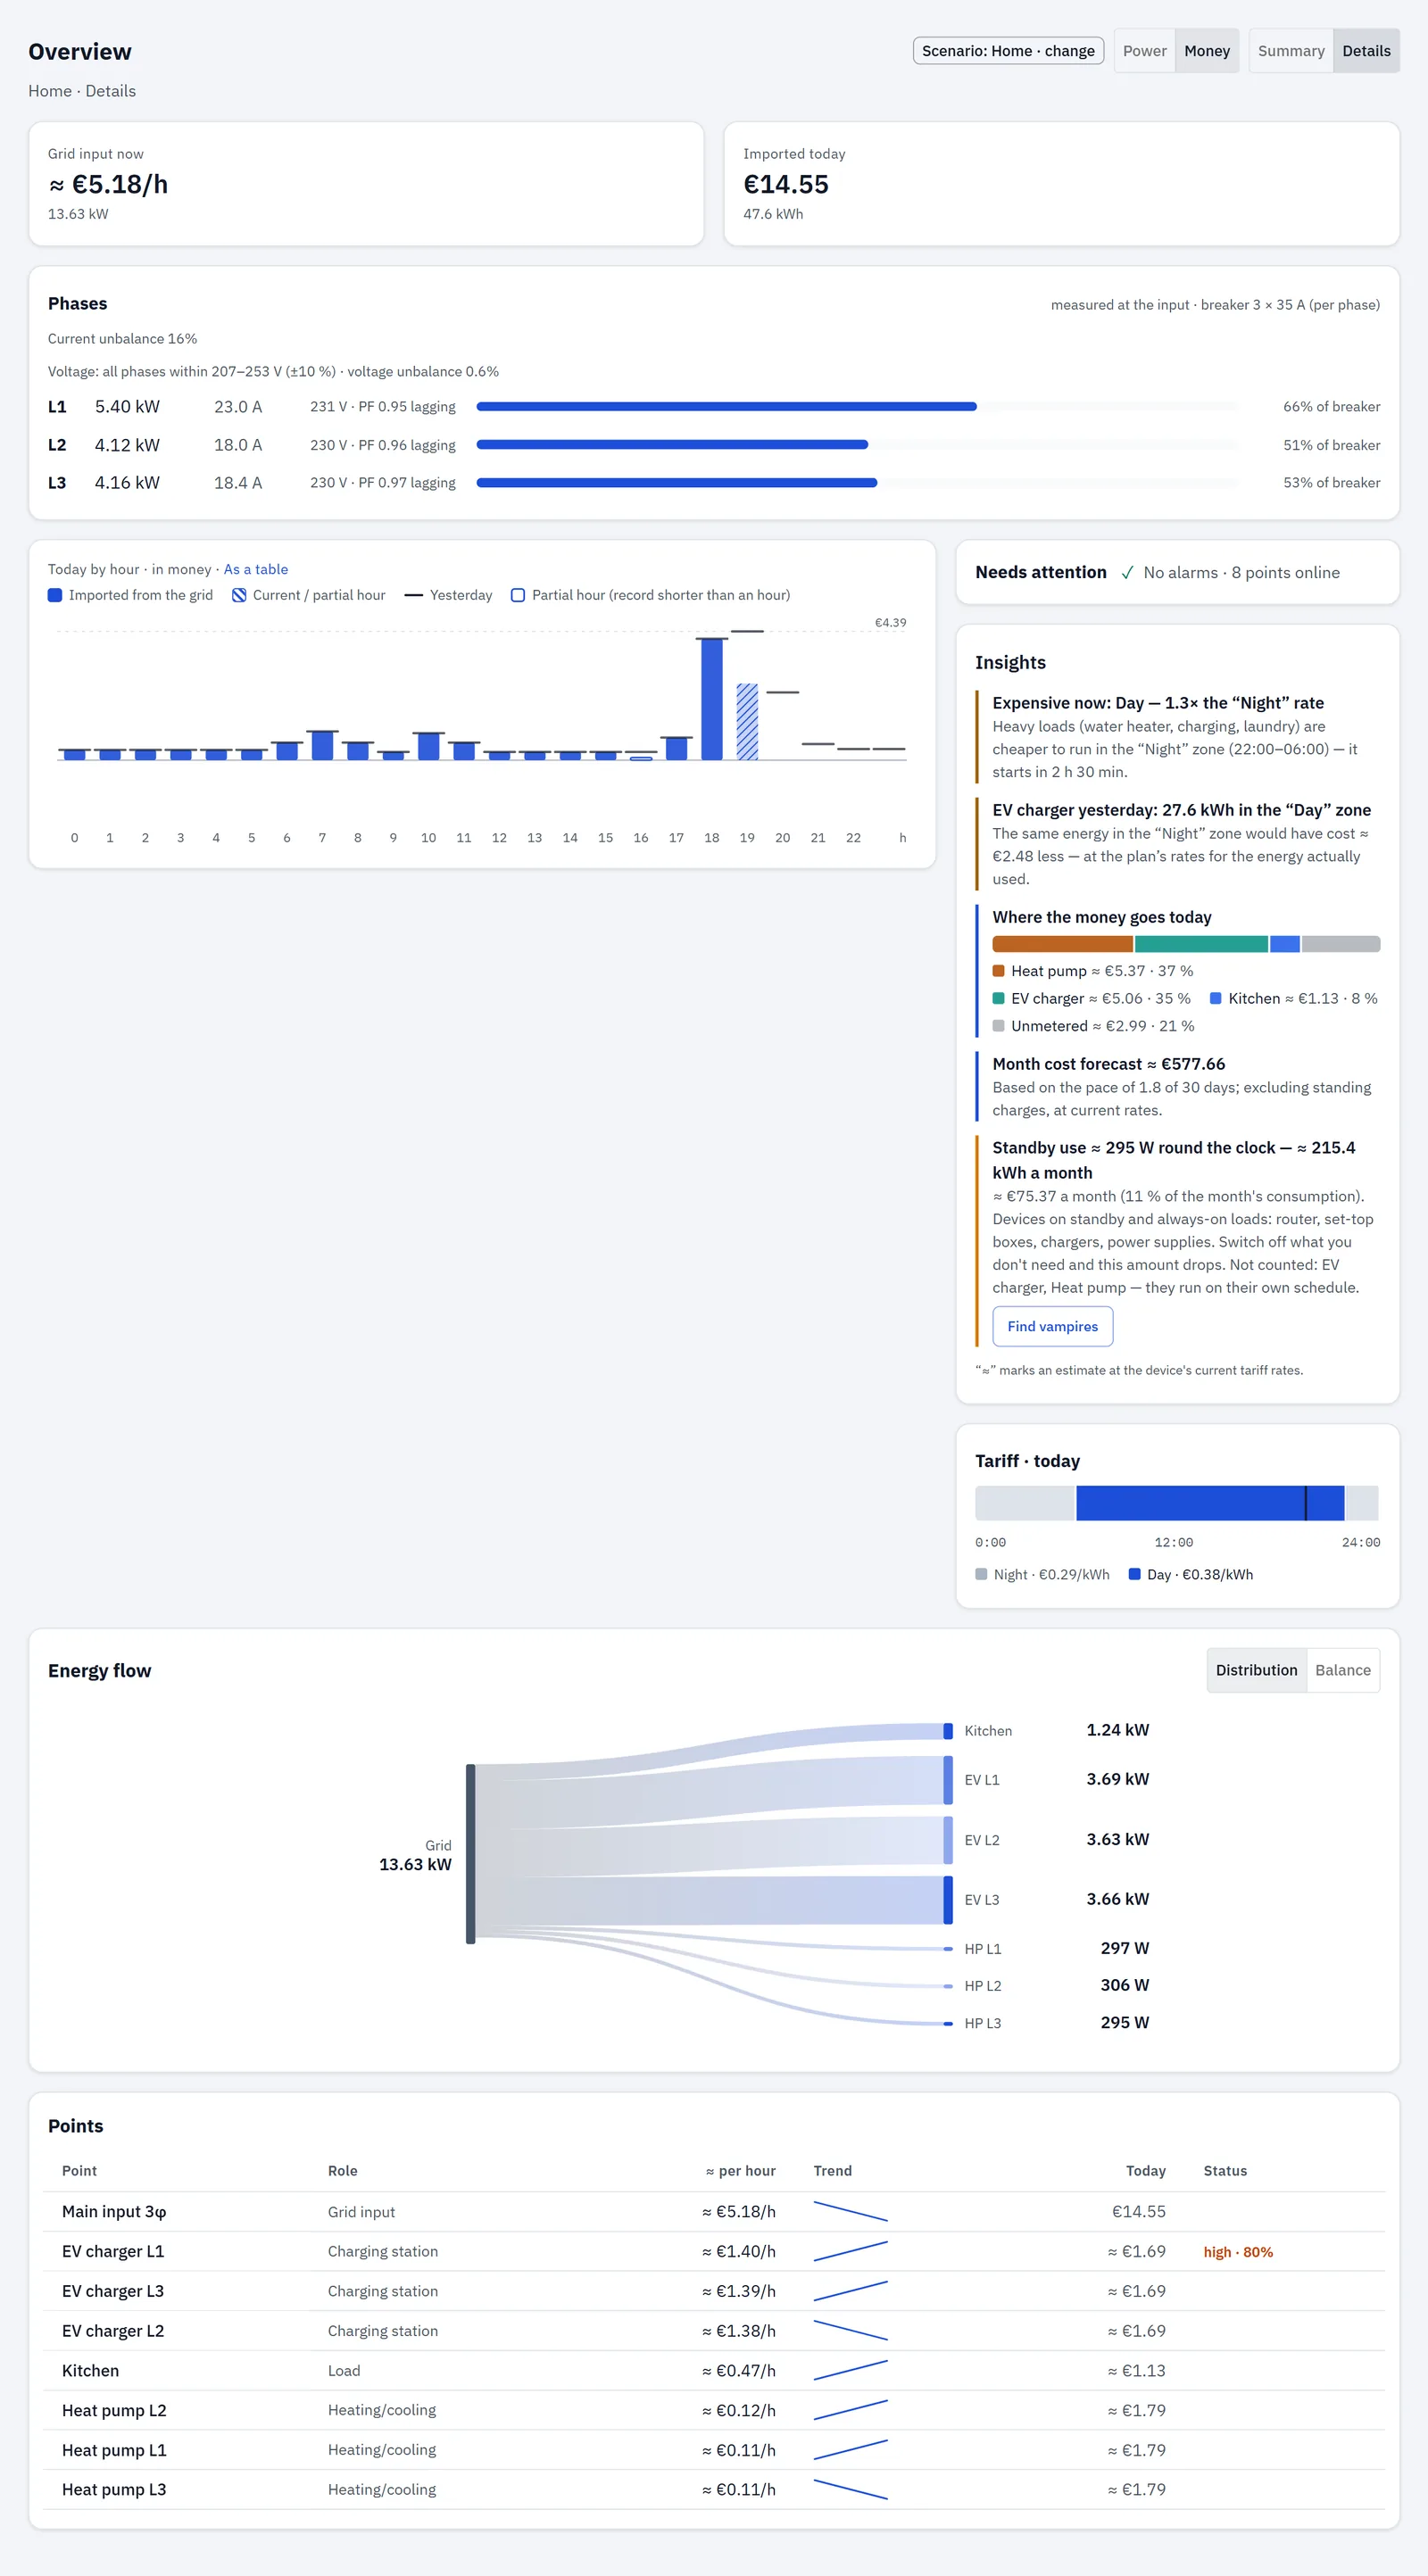
In order:
- KPI row.
- Phases (same condition as on Home).
- Today by hour chart; beside it Needs attention, Insights (with a tariff) and the Tariff · today ribbon.
- Energy flow with Distribution | Balance.
- Points table.
KPI row
| Tile | What it shows |
|---|---|
| Grid input now (or Exporting to grid) | The input power; "offline" when the input isn't answering. |
| Imported today | The day's import; "hub clock not set" when it isn't. |
| Exported today | Only with a solar point. |
| Cost today or Net today | Net today (cost − export value) in Money mode when you have solar and both hub totals are known. Otherwise Cost today, except in Money mode, where Imported today already shows the cost and no separate Cost tile is drawn. |
| Self-sufficiency | With solar: the share of the house load covered by solar now. |
| Input power factor | Without solar, when the input reports it: the value and leading/lagging. |
Points table
All points including the input: Point, Role, P (Money mode: ≈ per hour), Trend (power since you opened the page), Today and Status. The input's Today matches the Today card; a solar point shows its output. Besides the tile statuses, a line can show high · {pct}% (above 80 % of its rating) or above rating.
Tariff · today
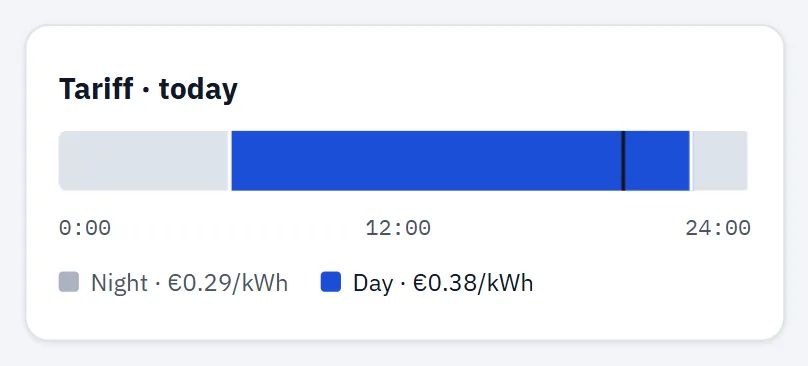
A 24-hour strip of today's time zones from your tariff plan, with the current zone highlighted, a now marker on the hub's clock and a legend "zone · rate". With no time zones: "No tariff zones set." Without a connection it says so and retries.
Energy flow
The energy-flow views show where the power goes right now. They are built from:
- Grid: the input's power, signed when the input measures direction (an rbAmp input always does).
- Solar: the power of your generation points.
- House: grid + solar when direction is known; otherwise the sum of the lines; otherwise the input.
- Consumers: every other metered line, batteries included. Lines under a group's main meter are counted once.
- Rest (not metered): house minus all metered lines, shown in grey when it's more than 5 % of the house and more than 50 W. When only the input is metered, it's always shown.
When nothing flows (everything below 5 W), the card says so and waits for a load to switch on.
Home: Diagram, By phase, Scene
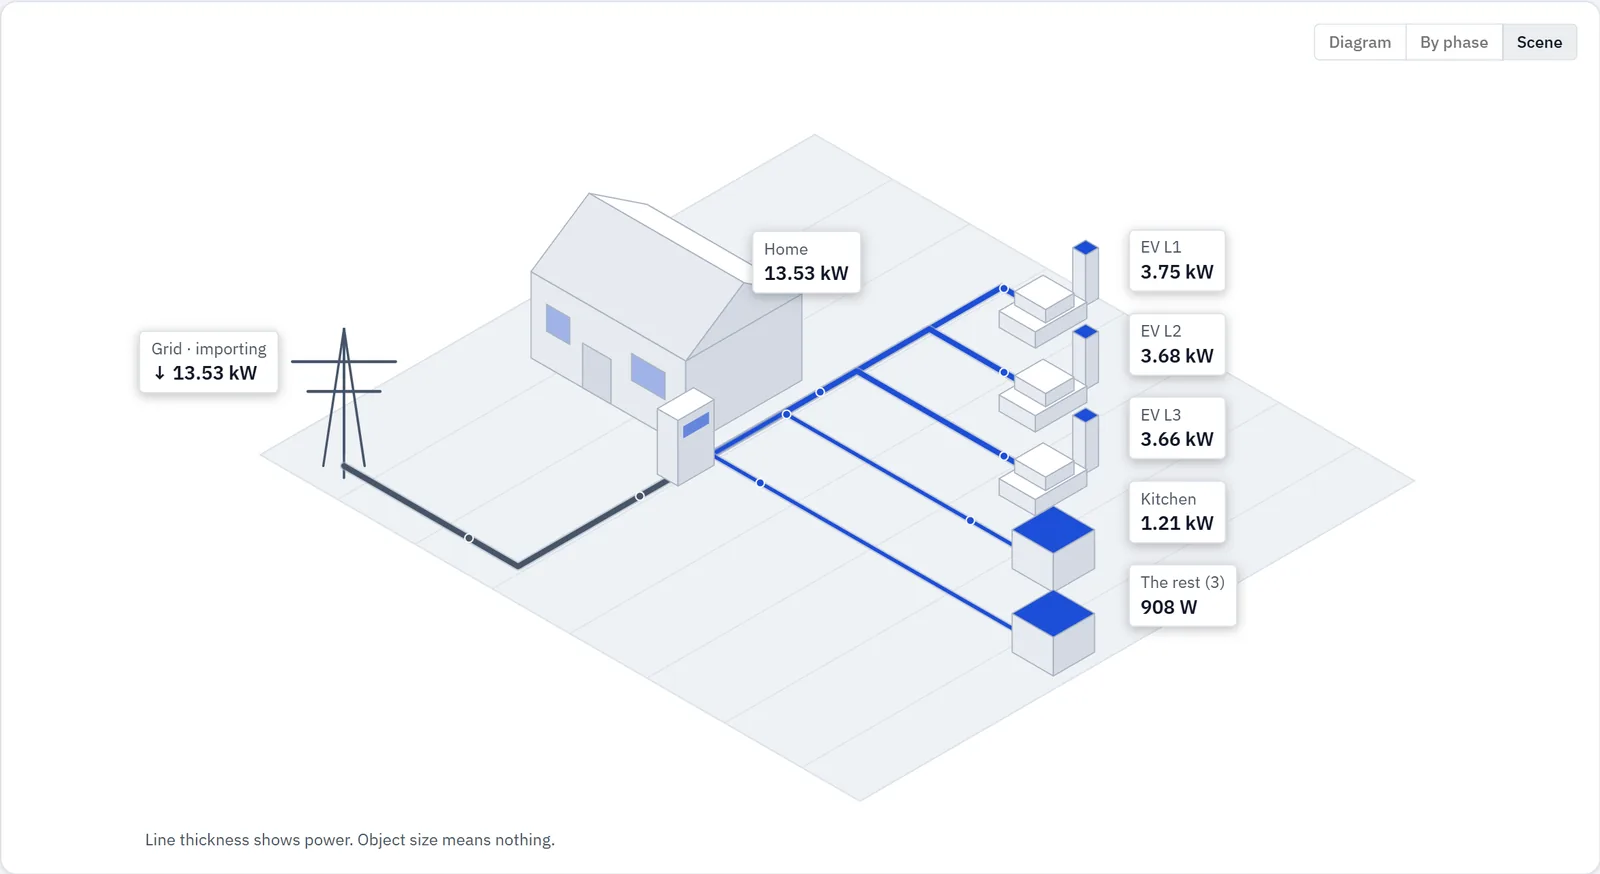
The Home card has three views; your choice is remembered in this browser:
- Diagram (default): Grid and Solar on top, the house in the middle, loads below, with live values. A ring shows "{pct}% from solar" when solar covers part of the house. On a narrow screen it becomes a compact list.
- By phase: offered when the input reports more than one phase. One column per phase with its power, current and share of the input; under each phase its single-phase lines and the rest of that phase that no line accounts for; multi-phase lines listed under Loads across phases. Lines without a phase set aren't placed under any phase; the card shows how many there are: "Lines without a phase: {n} — set the phase on the point page to place them under it."
- Scene: an illustrated house with up to five load objects; smaller loads are folded into "The rest". Line thickness shows power; the size of the objects means nothing.
If you've set up point groups, tabs above the diagram show All and one tab per group with its power. Within a group, power its main meter sees but no member line does appears as Other in group.
Details: Distribution and Balance
- Distribution: a flow chart from the sources (Solar, Grid) to each consumer and "To grid" for export. Solar is spread across loads in proportion. On a narrow screen it shows Balance instead.
- Balance: two bars on one kW scale, From (Solar, Grid) and To (loads and To grid).
Business and Charging stations
These scenarios use the single-line diagram described above.
Phases
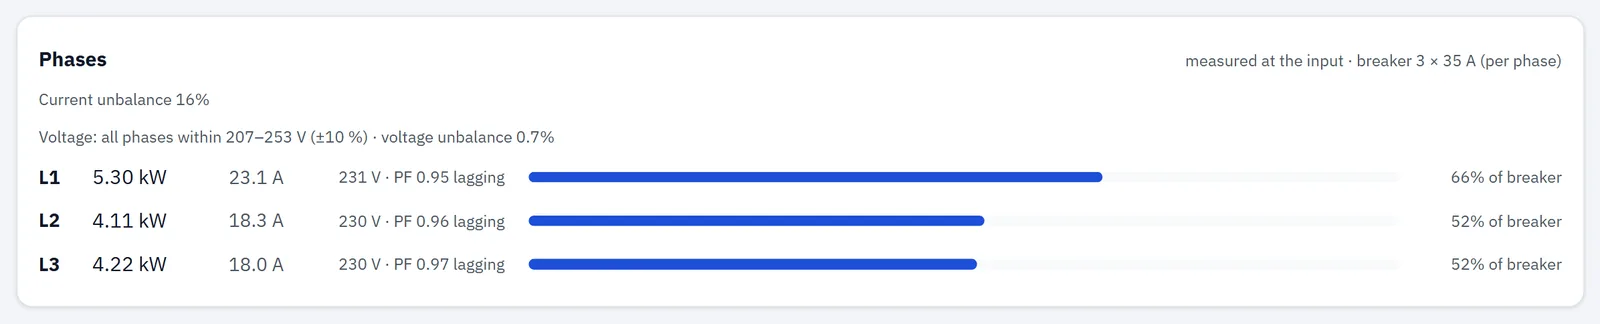
The Phases card appears when your mains is multi-phase (declared on the hub, or the input has reported more than one phase).
The header says where the figures come from:
- measured at the input: a three-phase module (U3I3) on the input measures each phase;
- estimated from lines: phases are added up from the lines you've assigned to a phase.
and your breaker setting ("breaker 3 × 25 A (per phase)", or "breaker rating not set").
Each phase row (L1, L2, L3) shows power (↑ for export) and current. When measured, it also shows:
- voltage, flagged low or high when it's more than 10 % below or above nominal;
- the angle against L1, for example ∠ −119.8°;
- cos φ, marked lagging or leading.
A bar shows the phase current against the breaker: above 80 % high, above 100 % overload.
The checks it reports
| Check | What it says |
|---|---|
| Phase rotation (measured, three phases) | "Phase rotation forward (L1 → L2 → L3)." — or reversed (L1 → L3 → L2), with a warning that three-phase motors and pumps will turn backwards — or that the phases aren't 120° apart, so a phase looks missing or wired to the wrong place. |
| Current unbalance | The largest deviation of a phase current from the average, as a percentage; above 20 % marked high. Assessed only from 1 A per phase; below that the card says so, because a single lamp swings the percentage. |
| Voltage band | whether all phases are within 207–253 V (10 % either side of 230 V), or which phases are outside, plus the voltage unbalance (highest minus lowest, over the average). |
| Coverage (estimate only) | When your lines cover less than 80 % of the input, the card warns that the phase load is understated; a U3I3 module on the input gives exact phase figures. |
If a frame arrives without phase data, the rows stay and show "no data".
Today by hour
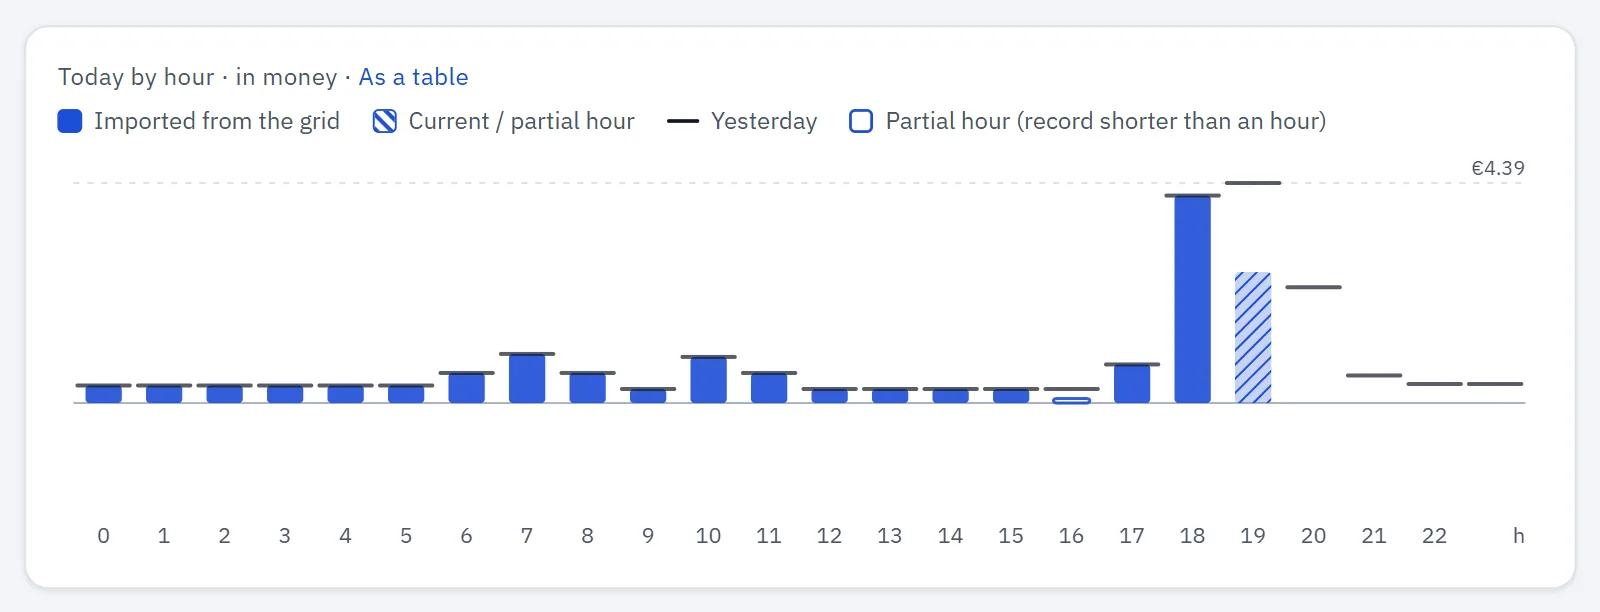
24 bars for today on the hub's clock: import upwards, export downwards, on one scale. In Money mode the title adds "· in money" and each hour shows its cost from the hub's hourly records (or energy × the current rate when the hub has none). As a table opens the same hours in History.
- With a solar point (Power mode), each bar shows the house's hour split into From grid and From solar (from the first generation point).
- The running hour is hatched ("Current / partial hour").
- A past hour with less than an hour of records is drawn as an outline ("Partial hour").
- A cap line marks Yesterday at the same hour.
- Export under 10 Wh in an hour is ignored as noise.
Insights
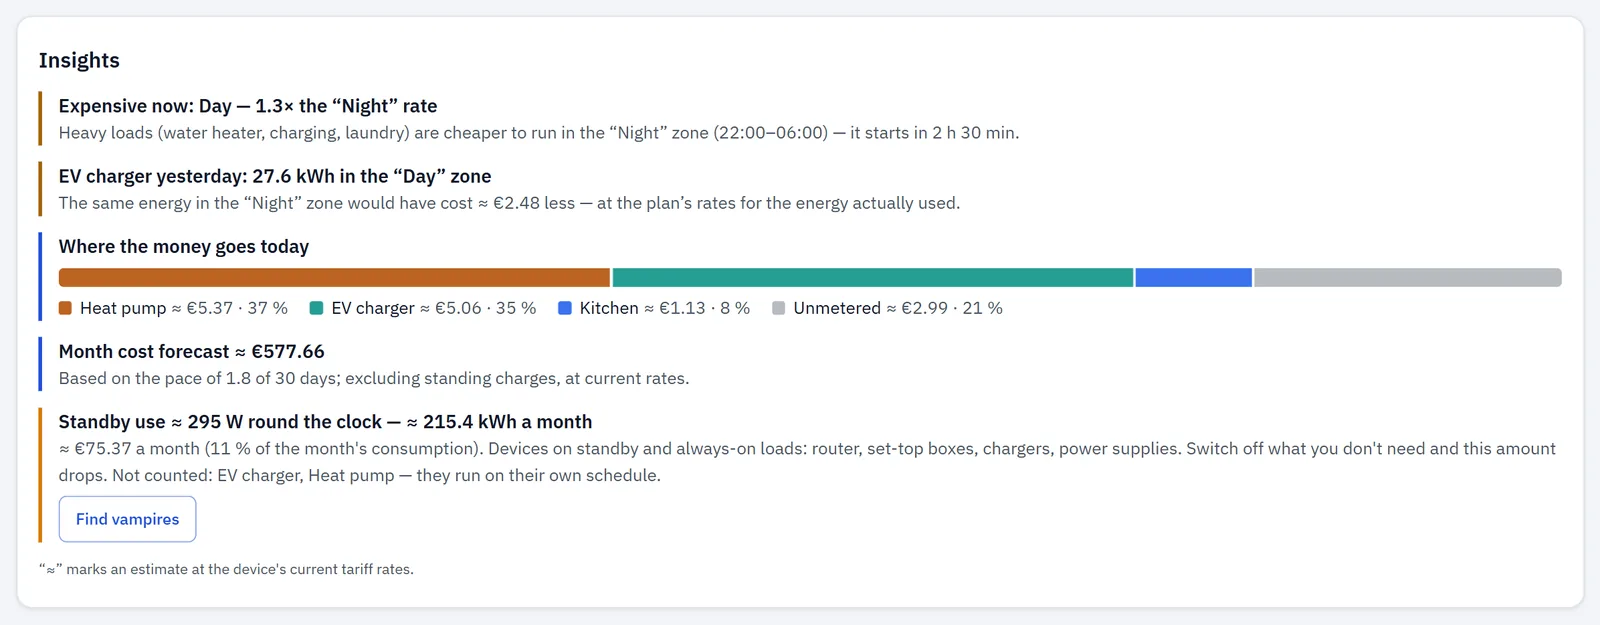
The Insights card turns your measurements and your tariff into short notes. It appears only when a tariff is set: on the Home Summary, and on Details in every scenario. The lens changes the units (Money: cost; Power: energy).
All money figures here are the app's estimates at your current rates, marked ≈. The card's footnote says so: "“≈” marks an estimate at the device's current tariff rates." (Power mode: "at the current pace").
Until there's enough data it reads: "Tips will appear once enough data is collected and a tariff is set."
Notes appear in this order, each only when its condition is met:
| Insight | What the card shows (pattern) | When it appears | How it's worked out |
|---|---|---|---|
| Surplus now | "Surplus is going to the grid now: {power}", with the card's estimate of the per-hour difference between your buy and sell rate for that energy (≈ {money}). | You have a solar point and export more than 200 W now. | Export power × (buy rate − sell rate) for one hour. |
| Expensive zone now | "Expensive now: {zone} — {ratio}× the “{cheapest}” rate", with the hours of the cheapest zone and how soon it starts. | The current rate is at least 1.2× today's cheapest zone, and no surplus note is shown. | Current buy rate ÷ the cheapest rate in today's plan. |
| Charging in a dearer zone (not Business) | "{station} yesterday: {energy} in the “{zone}” zone", with the card's estimate of what the same energy costs at the “{cheapest}” zone's rate (≈ {money} difference). | Yesterday at least 1 kWh of EV charging fell in a zone dearer than the cheapest, and your plan has more than one rate. | Yesterday's hourly charging energy, each hour priced at its zone, compared with the cheapest rate. |
| Where the money goes today (Power: "Where the energy goes today") | One bar: your three biggest lines by name, then "Other points", then "Unmetered". It shows ≈ money only when every part has a cost; otherwise it shows kWh for all parts. | There's import today and more than one row to show. | Each line's energy today as a share of the input's, times today's cost. Points in one named group with the same role (for example a three-phase charger) are one share under the group's name. "Other points" = the remaining lines; "Unmetered" = input minus all lines. "Other points" and "Unmetered" are left out below 1 %. |
| Month forecast | "Month cost forecast ≈ {money}" — "Based on the pace of {elapsed} of {days} days; excluding standing charges, at current rates." (Power: "Month consumption forecast ≈ {energy}".) | There's month-to-date data. | The month so far, extended to the whole month at the pace so far. If the hub's data starts later than the 1st, the text says since when and that the forecast firms up over the next days. With less than one day of data: "The month forecast appears after the first full day." |
| Today vs yesterday | "Today costs ≈ {pct}% more/less than yesterday by this hour" (Power: "uses"), with both figures for the closed hours since midnight. | The difference is at least 10 % and yesterday's same hours are complete. | Today's closed hours compared with yesterday's same hours. No projection. |
| Solar today | "Solar today: produced {energy}", what the house used itself and its value at your buy price, and what was exported and its value. | A solar point produced energy today. | Self-used = produced − exported, valued at today's average buy price; export from the hub's export counter, or exported energy × sell rate. |
| Standby use (Business: Base load outside working hours) | "Standby use ≈ {power} round the clock — ≈ {energy} a month", and with a tariff its estimated monthly cost (≈ {money} a month) and its share: "({pct} % of the month's consumption)". If it rose over the last nights, the card says by how much and asks whether a new device is on standby. | The night-time floor is above 0.5 W. | See below. |
How the standby figure is worked out
The app looks at the quiet hours of the night, 01:00–05:00 on the hub's clock:
- It takes the input's hourly records of the last 8 days. Hourly power of EV-charging and heating/cooling lines is taken out first, since they run on their own schedule; the card names them under "Not counted".
- For each night it takes the middle value (median) of those hours. A night is skipped if it has export, fewer than 2 hours, or an unusual spike.
- The standby figure is the median over at least 3 nights. When the hub already keeps its own night-time base figure over 3 nights or more, the app uses that.
- Energy per month = standby power × 730 hours. The monthly cost uses your plan's week-average buy rate.
- "It rose" compares the last 3 nights with the earlier ones (needs 5 nights).
Before 3 nights are in, the card reads "Standby use: collecting data — {n} of 3 nights". With no usable night yet, it shows "Standby use: find devices on standby". The Find vampires button is there in all these states, in every scenario except Business (on Home and Charging stations also in Details).
Find vampires
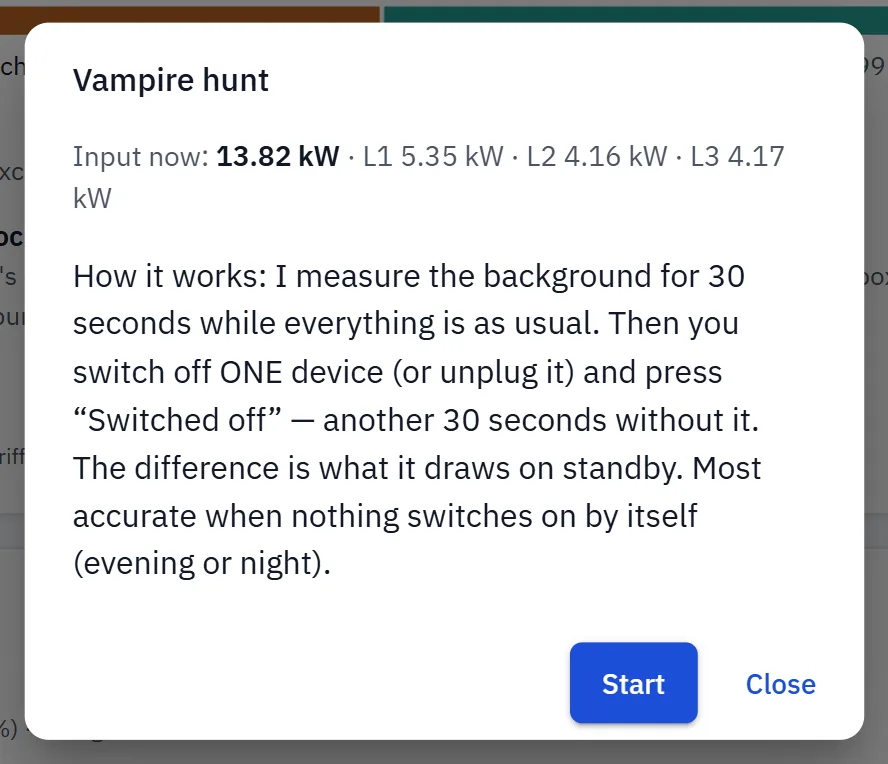
Find vampires (everywhere except Business) opens a short guided test that finds devices on standby from the steps they leave in the live input power:
- Press Start and leave everything as it is. The app measures the background for 30 seconds.
- Switch off or unplug one device and press Switched off right away. The app tells you the smallest step it can tell from noise at the moment.
- After a 3-second pause it measures for another 30 seconds. Don't switch anything else.
The result is the difference between the two 30-second medians, for example "−4.2 W (L2)" (the phase is named when one phase carries 70 % of the step or more), with "Round the clock that is ≈ {energy} a month · ≈ {money}/mo" at your week-average rate. Give it a name and press Save, then Next device.
Other outcomes: the power rose (something switched on — try again); the step is below what the meter can tell from noise; or too few readings came in (the connection dropped).
- A step counts when it's at least twice the input's resolution and three times the measured noise.
- The test can't run while the input isn't answering. While you export, the app suggests hunting in the evening or at night, because the sun moves the power more than a standby device draws.
- The Found list, with its total, is kept in this browser only, not on the hub.
Banners and alerts
Banners appear at the top of the Overview, in this order:
| Banner | When it appears |
|---|---|
| data delayed (chip) | Live frames from the hub arrived with gaps. |
| No connection to the device — showing data from {time}. | The hub doesn't answer; figures dim and show the last data. |
| The device withholds live data without a read token… | The hub needs a read token; enter it in Settings → Security. |
| The hub still has its factory settings: … | The site has no name, or money is counted with the sample tariff. Set up → opens the setup wizard; Hide hides it in this browser. |
| Hub access warning | Hub firmware v1.1.2 and later: no API token is set, or the hub's own Wi-Fi still uses its setup password, or both. Without a token the hub doesn't report the access-point status, so the warning stays until both are set. Buttons Access-point password and API token; Hide hides it for this browser session. |
| Hub time note | The hub's time zone differs from your browser's by 30 minutes or more. If the hub is where you are, set its time zone (Time); otherwise days, hours and tariff zones are shifted. |
| Scenario preview | A scenario preview is active in this browser; Back ends it. |
| Sensors not responding: {n} of {m}. Their readings are not counted. | At least one point isn't answering. What to check opens the Events page. |
The setup banner and the hub time note never show in the demo. While the connection is lost, the setup banner, the hub access warning, the hub time note and the "Sensors not responding" strip are hidden.
Inside the cards you may also see: the reversed-sensor and phase-sign checks (Power hero), the example-tariff and clock notes (Today), and the limit-below-breaker question (Grid input vs limit).
When a point stops answering, the cards show it in place: "held" on the hero, "offline" on tiles, "—" in tables, greyed flow diagrams.
With no points at all, the Overview shows "No metering points yet" with an Add sensor button that opens the setup wizard.