Events
Events tells you when something needs a look: a sensor that stopped responding, a hub restart, or a lost connection to the hub. It also shows the hub's own log. Open it from the app's left navigation: Monitoring → Events.
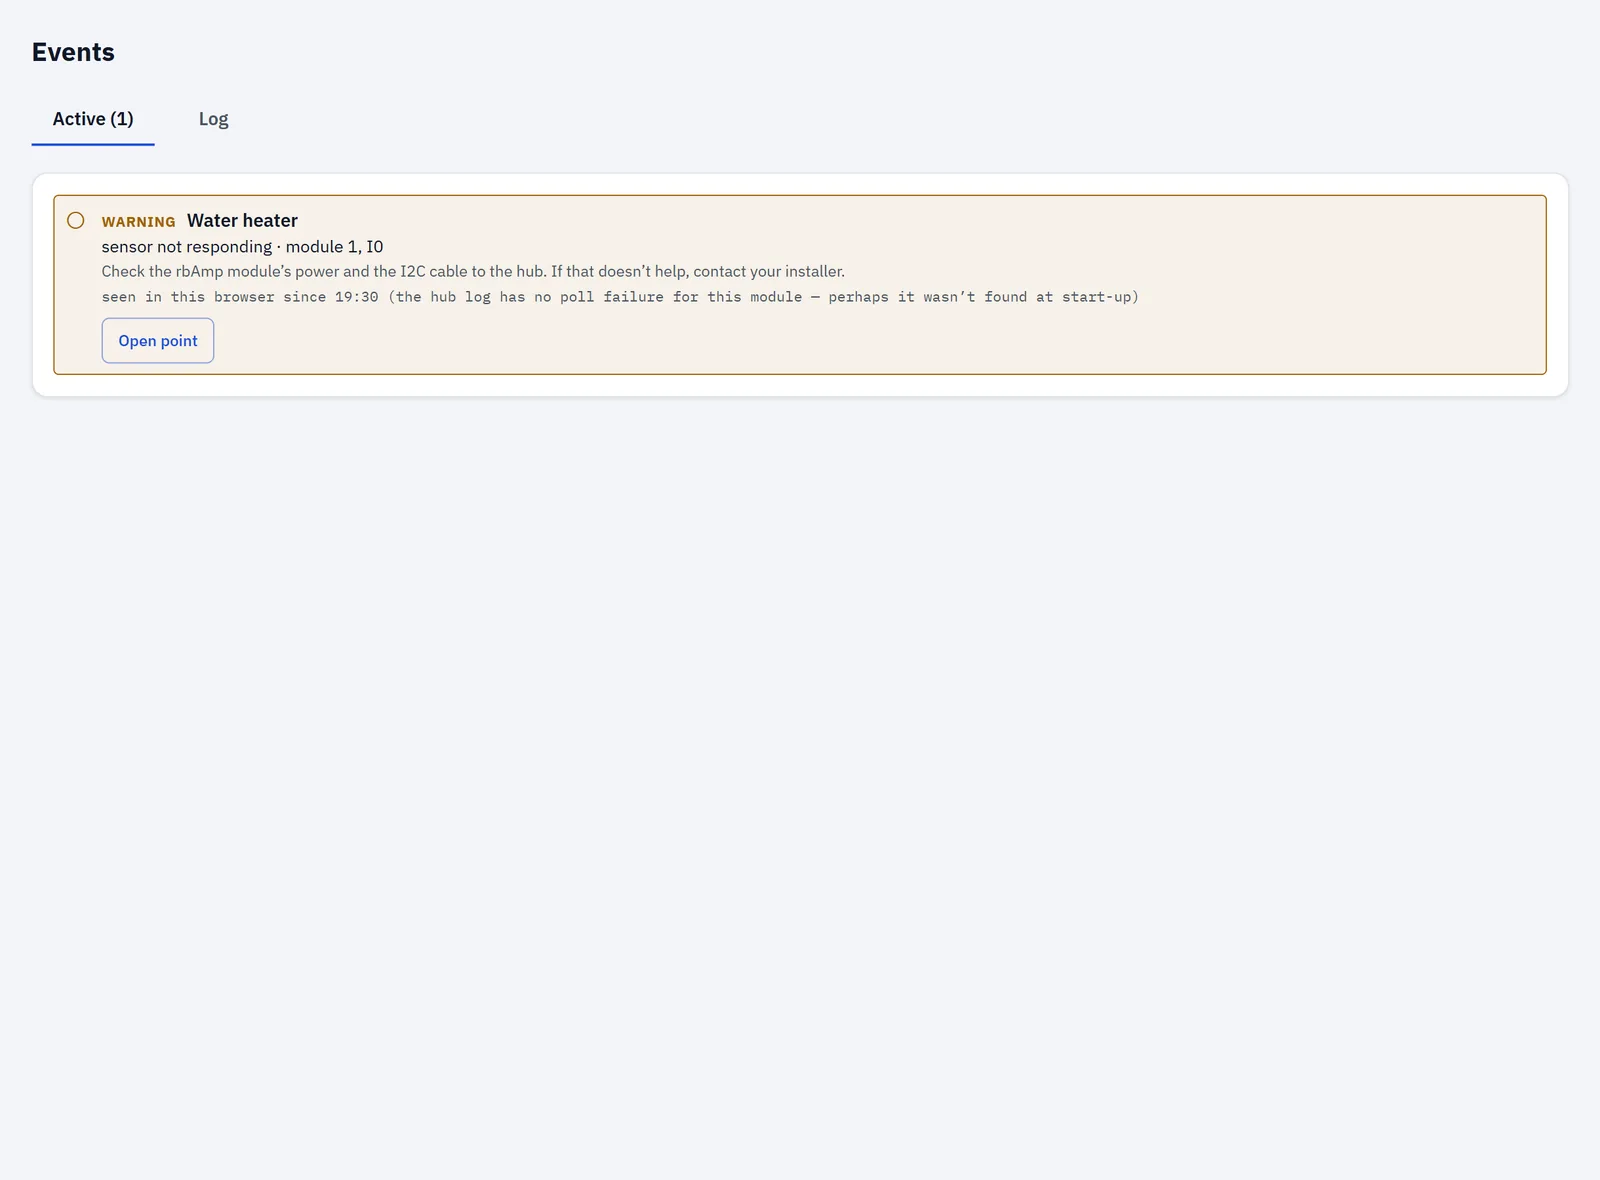
Tabs
| Tab | What it shows |
|---|---|
| Active (n) | what needs attention now; n counts the cards |
| Log | the same cards, followed by the Hub log |
When there is nothing to show, the page says "✓ No active alarms". That message isn't shown while the connection to the hub is lost, because the app can't know the current state.
Banners
Banners appear above the cards.
Connection lost
If the app hasn't heard from the hub for 15–20 seconds:
No connection to the hub since time. The alarm state is unknown — the last known is shown below.
What you see below the banner is the last known state, not the current one. If the app never got any data from the hub, the banner reads "No connection to the hub. The alarm state is unknown." The banner isn't shown in demo mode.
What to check: that your phone or computer is still on the hub's network, and that the hub has power. The banner clears by itself when the connection is back.
The hub restarted
If the hub restarted in the last 7 days (and its clock was set at the time), a banner says when and why:
The hub restarted day month, time — reason.
If it was off or down for more than a minute, the banner adds: "It was off or down for ≈ duration; history records for that time may be missing, but “today” counts it from the hub's counters." (see History).
| Reason | What it means | What to check |
|---|---|---|
| power-on | the hub was switched on, or its power came back | if you didn't switch it off, check its power supply |
| planned restart (settings, update) | the hub restarted itself after a settings change or an update | nothing; this is expected (shown as information) |
| task watchdog | a task on the hub stopped responding and the hub restarted itself | if it repeats, copy the hub log and contact support |
| software fault | the hub's firmware hit an error and restarted | if it repeats, copy the hub log and contact support |
| unknown reason | the hub didn't report a reason | if it repeats, copy the hub log and contact support |
A planned restart is shown as information; the others as a warning. If the hub reports a reason code the app doesn't know, the code is shown as is. The What to check column is our advice; the banner itself shows only the reason.
Sensor not responding
One card appears for each bound point whose sensor isn't answering.
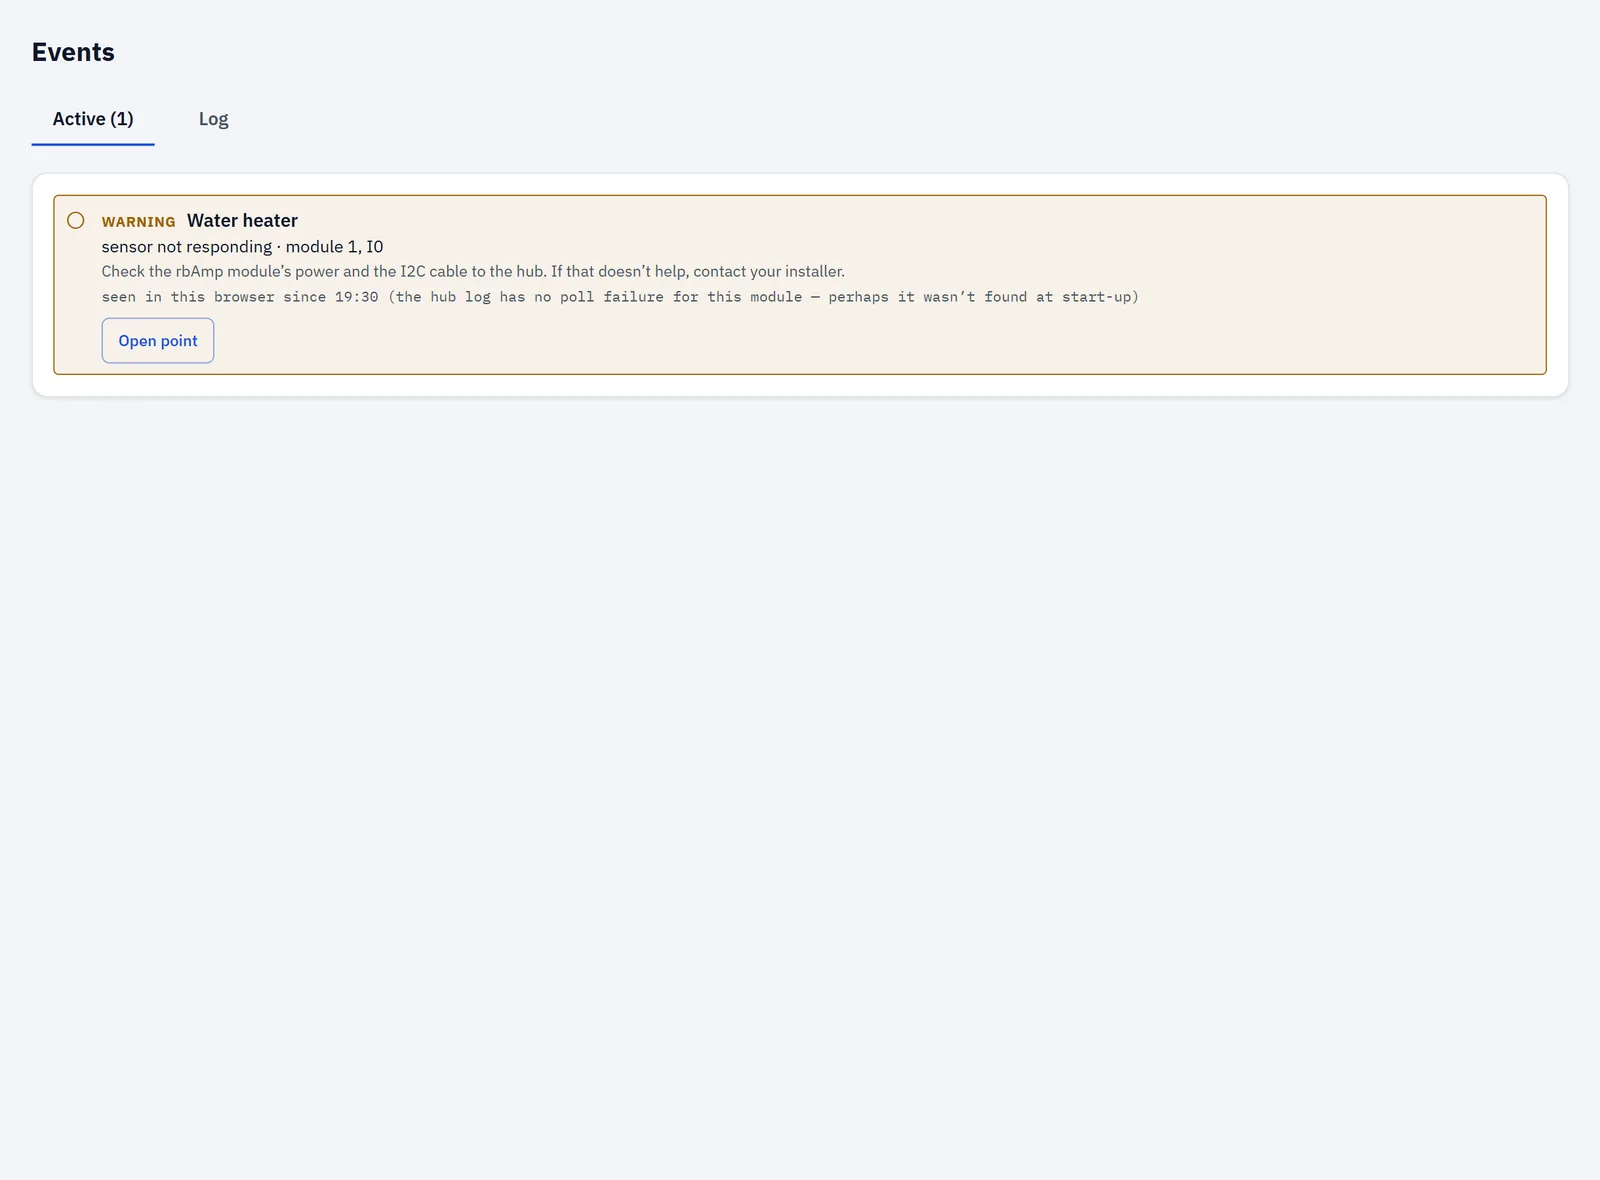
The card shows:
- the severity, warning;
- the point's name;
- "sensor not responding", followed by " · module n, channel" when the hub reports the module;
- since when, taken from the hub log when it can be:
- "the hub has logged poll failures since time" — the hub could read the module before and now can't;
- "the hub didn't find the module at start-up (time) and keeps looking" — the module wasn't there when the hub started;
- otherwise: "seen in this browser since time (the hub log has no poll failure for this module — perhaps it wasn’t found at start-up)";
- Open point, which opens the point's page.
While any sensor is silent, the app re-reads the hub log every minute.
What to check
- The rbAmp module's power and the I2C cable to the hub (the card's own advice).
- Points → rbAmp modules (n): does the module card say not found? Does the page show a bus warning ("A module bus line is held low…" or "The module bus is stuck…")? See Points.
- If the hub didn't find the module at start-up, check the module's connection. The hub keeps looking for it.
- If that doesn't help, open the Hub log, press Copy and contact your installer or support.
A point bound to a channel that the fitted module doesn't have doesn't get this card. Its own page says so instead (see Points).
Hub log
The Hub log (on the Log tab) is what the hub recorded itself: restarts and their causes, updates, Wi-Fi, module poll failures, and hours and days closing. The lines are technical, meant for an engineer or support.
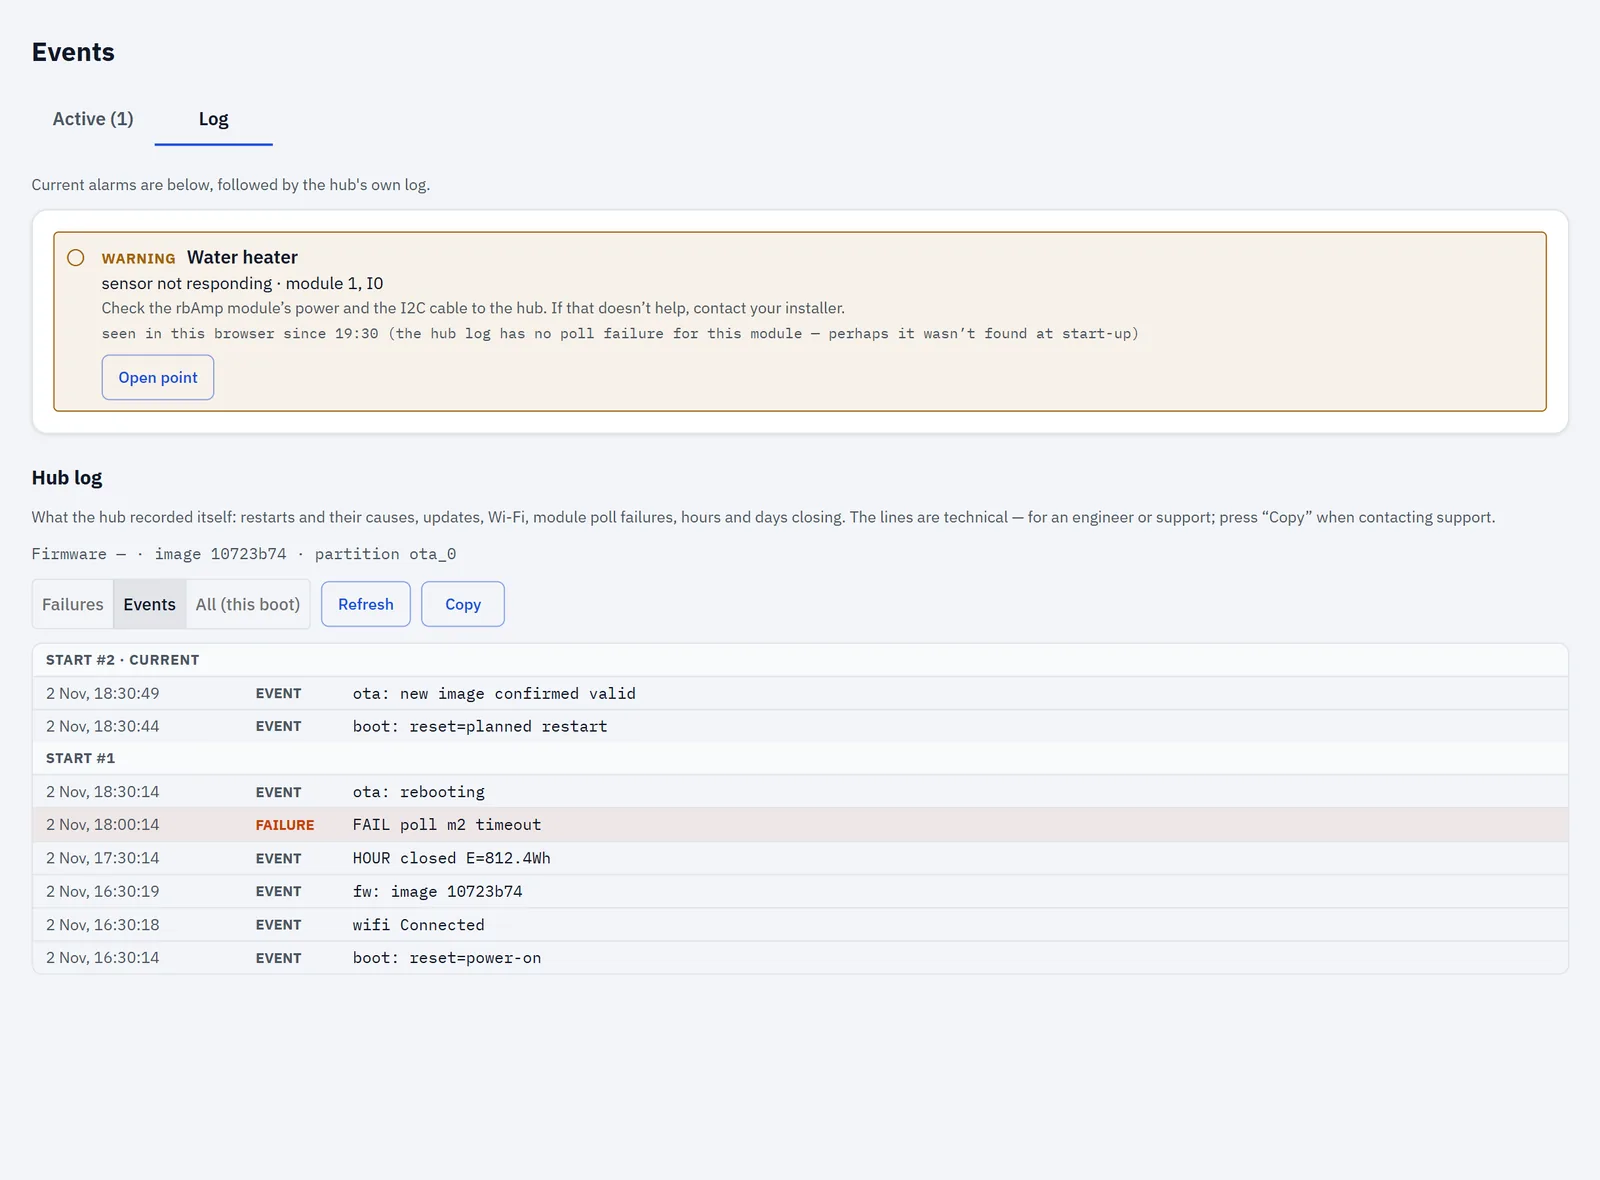
At the top is the hub's firmware line: the version, a short image ID and the partition it runs from.
Filter
| Filter | Shows |
|---|---|
| Failures | failures only |
| Events (default) | events and failures |
| All (this boot) | everything, including routine lines; routine lines exist only for the current start |
Reading the rows
- Newest first, grouped by start: "Start #n", with "· current" on the running one.
- The time is on the hub's clock, with seconds. Before the clock was set, it reads "s s after start".
- Each row has a level: failure, event or routine. Failure rows are highlighted. The message is shown as the hub wrote it.
One load reaches back a fixed stretch of the log; Show earlier loads more.
Buttons
- Refresh reloads the log.
- Copy puts a short firmware line (when the version is known) and the shown rows on your clipboard as plain text, one tab-separated row per line. The button reads "Copied" for 2 seconds; it is off when no rows are loaded. Paste the text into your message when you contact support.
Messages
| Message | What it means |
|---|---|
| Failures recorded since the last start: n. | the hub logged n failures since it last started |
| The hub can't read its log files right now — only lines since the last start are shown. | older lines aren't available at the moment |
| The log didn't load: the hub isn't answering or its firmware doesn't keep a log. | check the connection; firmware without a log can't show one |
| No records. | the log is empty for this filter |
A failed module firmware update has a Hub log → link (see Sensors and modules). It opens Events on the Active tab; switch to Log to see why.