History
History shows what the hub has recorded for your points: energy, power, voltage, reactive power and money, by hour, day or month. Open it from the app's left navigation: Monitoring → History.
Everything on this page comes from the records stored on the hub. The hub keeps history for up to 12 points (see Points).
Periods and bucket sizes
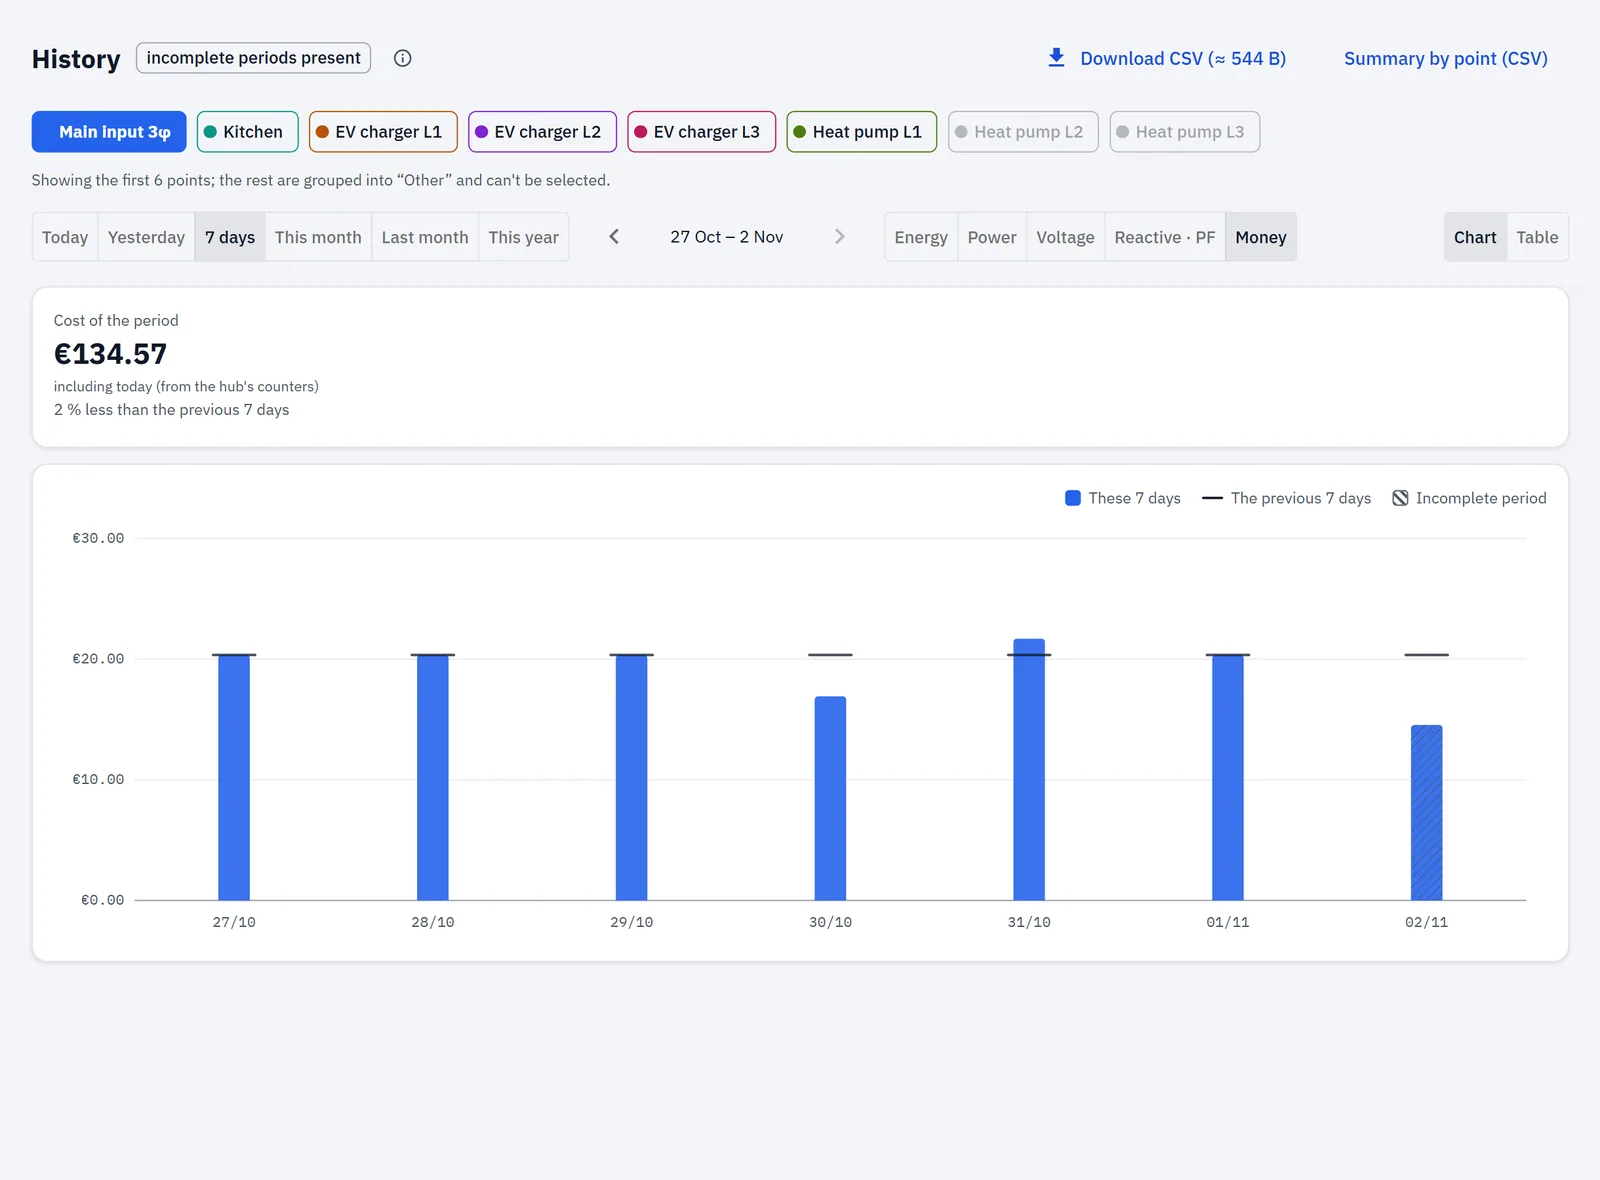
Pick a period with the buttons at the top. There is no custom date range: you choose one of the preset periods, then step back and forward with the ‹ › arrows, one whole period at a time. › is greyed out while you are on the current period. The label between the arrows shows the period on screen, for example "16 Oct", "10 Oct – 16 Oct", "September 2026" or "2025".
| Button | Period | One bar or step = | Compared with |
|---|---|---|---|
| Today | midnight to now | 1 hour | yesterday, up to the same hour |
| Yesterday | the whole previous day | 1 hour | the day before |
| 7 days | the last 7 days, including today | 1 day | the previous 7 days |
| This month | the 1st of the month to now | 1 day | last month, up to the same day |
| Last month | the whole previous month | 1 day | the month before |
| This year | 1 January to now | 1 month | last year, the same months ("last year to this date") |
After you step back with ‹, the comparison is always "the period before".
- Periods follow the hub's clock and time zone, not your phone's or computer's (see Time).
- Today and Yesterday always show the full 0–24 h axis.
- History has no week step. For a by-week view of one point, use the trend card on the point's own page (see Points).
- The app remembers your period, metric, view and comparison choices while the browser tab stays open.
Metrics
| Metric | How it is drawn | What it shows |
|---|---|---|
| Energy | bars: import up, export down | imported and exported energy per hour, day or month |
| Power | line | average power |
| Voltage | line, with dashed lines 10 % above and below the nominal voltage; with one point selected, a shaded band from the lowest to the highest voltage | average voltage, and its minimum and maximum |
| Reactive · PF | a line of reactive power, with a separate power factor (cos φ) strip below it | reactive power and power factor |
| Money | bars: cost up, export value down | cost and export value at your tariff |
The power factor strip shows when the records carry a power factor. Its scale is at least 0.5–1.0 and widens when the data falls outside it. Its caption: "cos φ (power factor): 1 — all power is useful; below 0.9 — a noticeable reactive load".
Money is shown in the currency of your tariff plan (see Tariffs).
Hourly lines are drawn as steps; daily and monthly lines, and voltage, as smooth curves.
Choosing points
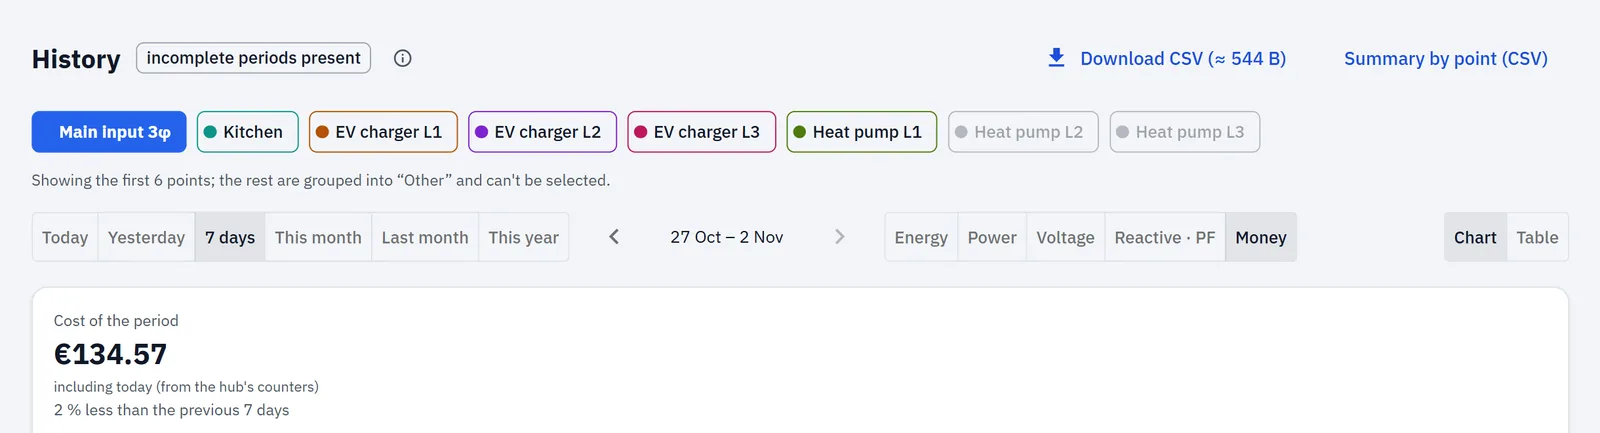
Each point is a chip in its own colour above the chart. Tap a chip to add it to the chart or take it off. When you open the page, the first point (in point-ID order) is selected.
The chart shows up to six points at once. With more than six points, the first six (in point-ID order) can be selected. The others stay in the chip row, greyed out, and can't be selected.
Points that are configured but not reporting live values right now are still listed, because their stored records don't need a live connection.
If you see "No points available.", no point has been set up yet. "Select a point." means none is selected.
Total and parts
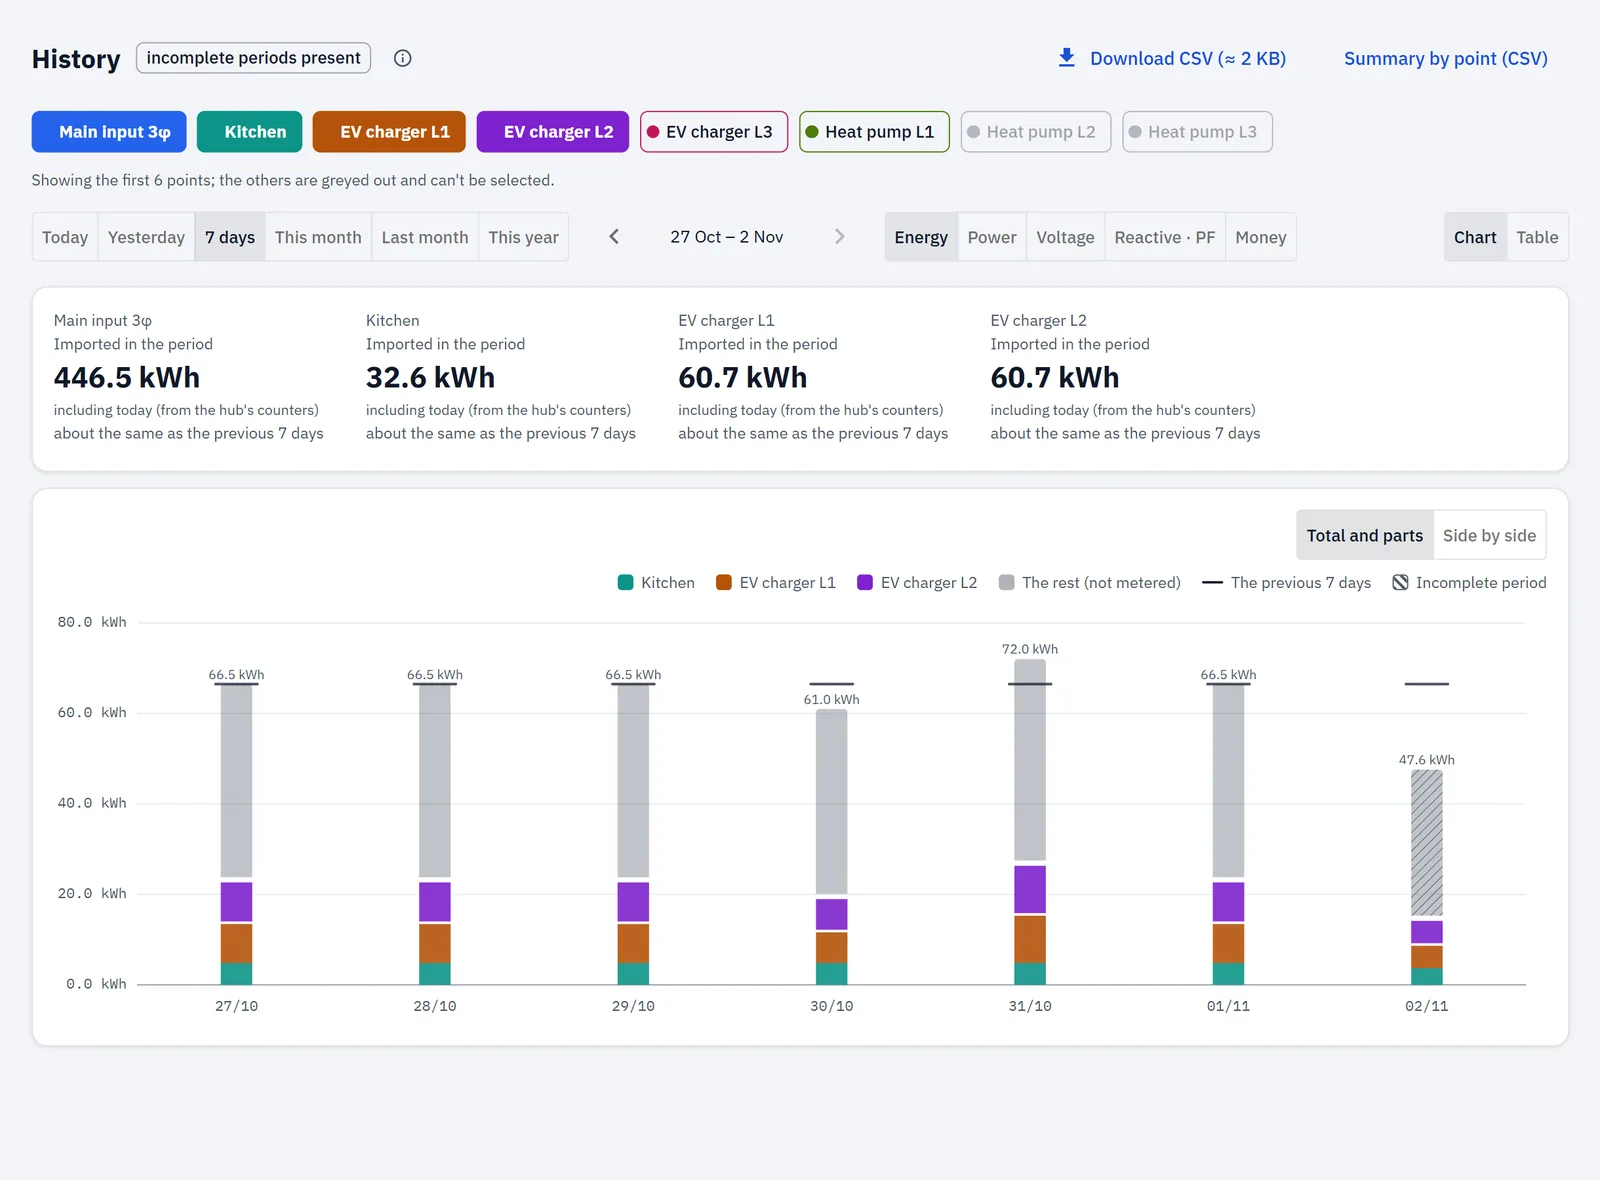
When you select the input together with at least one other point, and the metric is Energy or Money, a toggle appears:
- Total and parts (the default): one bar per slot. The selected lines are stacked in their own colours, and the rest of the input's value is drawn in grey as "The rest (not metered)". The input's total is printed above the bar when there's room for it. Export goes down from zero.
- Side by side: each point gets its own bar.
"The rest" is the part of your supply that none of the selected points measures.
Comparison with the previous period
The chart can draw the previous period behind the current one, for one point at a time:
- with one point selected, that point;
- in Total and parts, the input;
- with several points side by side, the point you choose under Compare with the previous period (or No comparison).
On lines, the previous period is the same colour, thinner and faded. On bars, it is a dark mark at the previous value over each slot. With one point selected, the legend names both periods, for example "Today" and "Yesterday"; after stepping back they read "This period" and "The previous period". In Total and parts, and with several points side by side, the legend shows only the previous period; side by side, it carries the point's name, for example "Yesterday · Kitchen".
The chart draws the whole previous period. The percentage in the totals card compares only the matching part of it (for example, today until now against yesterday until the same hour).
The totals card
With Energy or Money, a card above the chart sums the period for each selected point:
- Imported in the period (Energy) or Cost of the period (Money), with "exported …" or "earned …" on a second line;
- for a generation point with Energy: Produced in the period, with no "exported …" line (with Money it shows Cost of the period);
- a change line: "… % more than …", "… % less than …", "about the same as …" (a change under 0.5 %), or "nothing to compare with — no data for the previous period".
The change compares closed records only, and only when the previous period has at least as many records as the current one.
On the running periods (Today, 7 days, This month, This year), the figure includes today from the hub's own counters, so it matches the Overview. A note under the figure says so. On Today, the bars show closed hours only, while the figure includes the current hour. On a running week or month, today's bar is added from the live counters and drawn as a partial day.
Chart or table
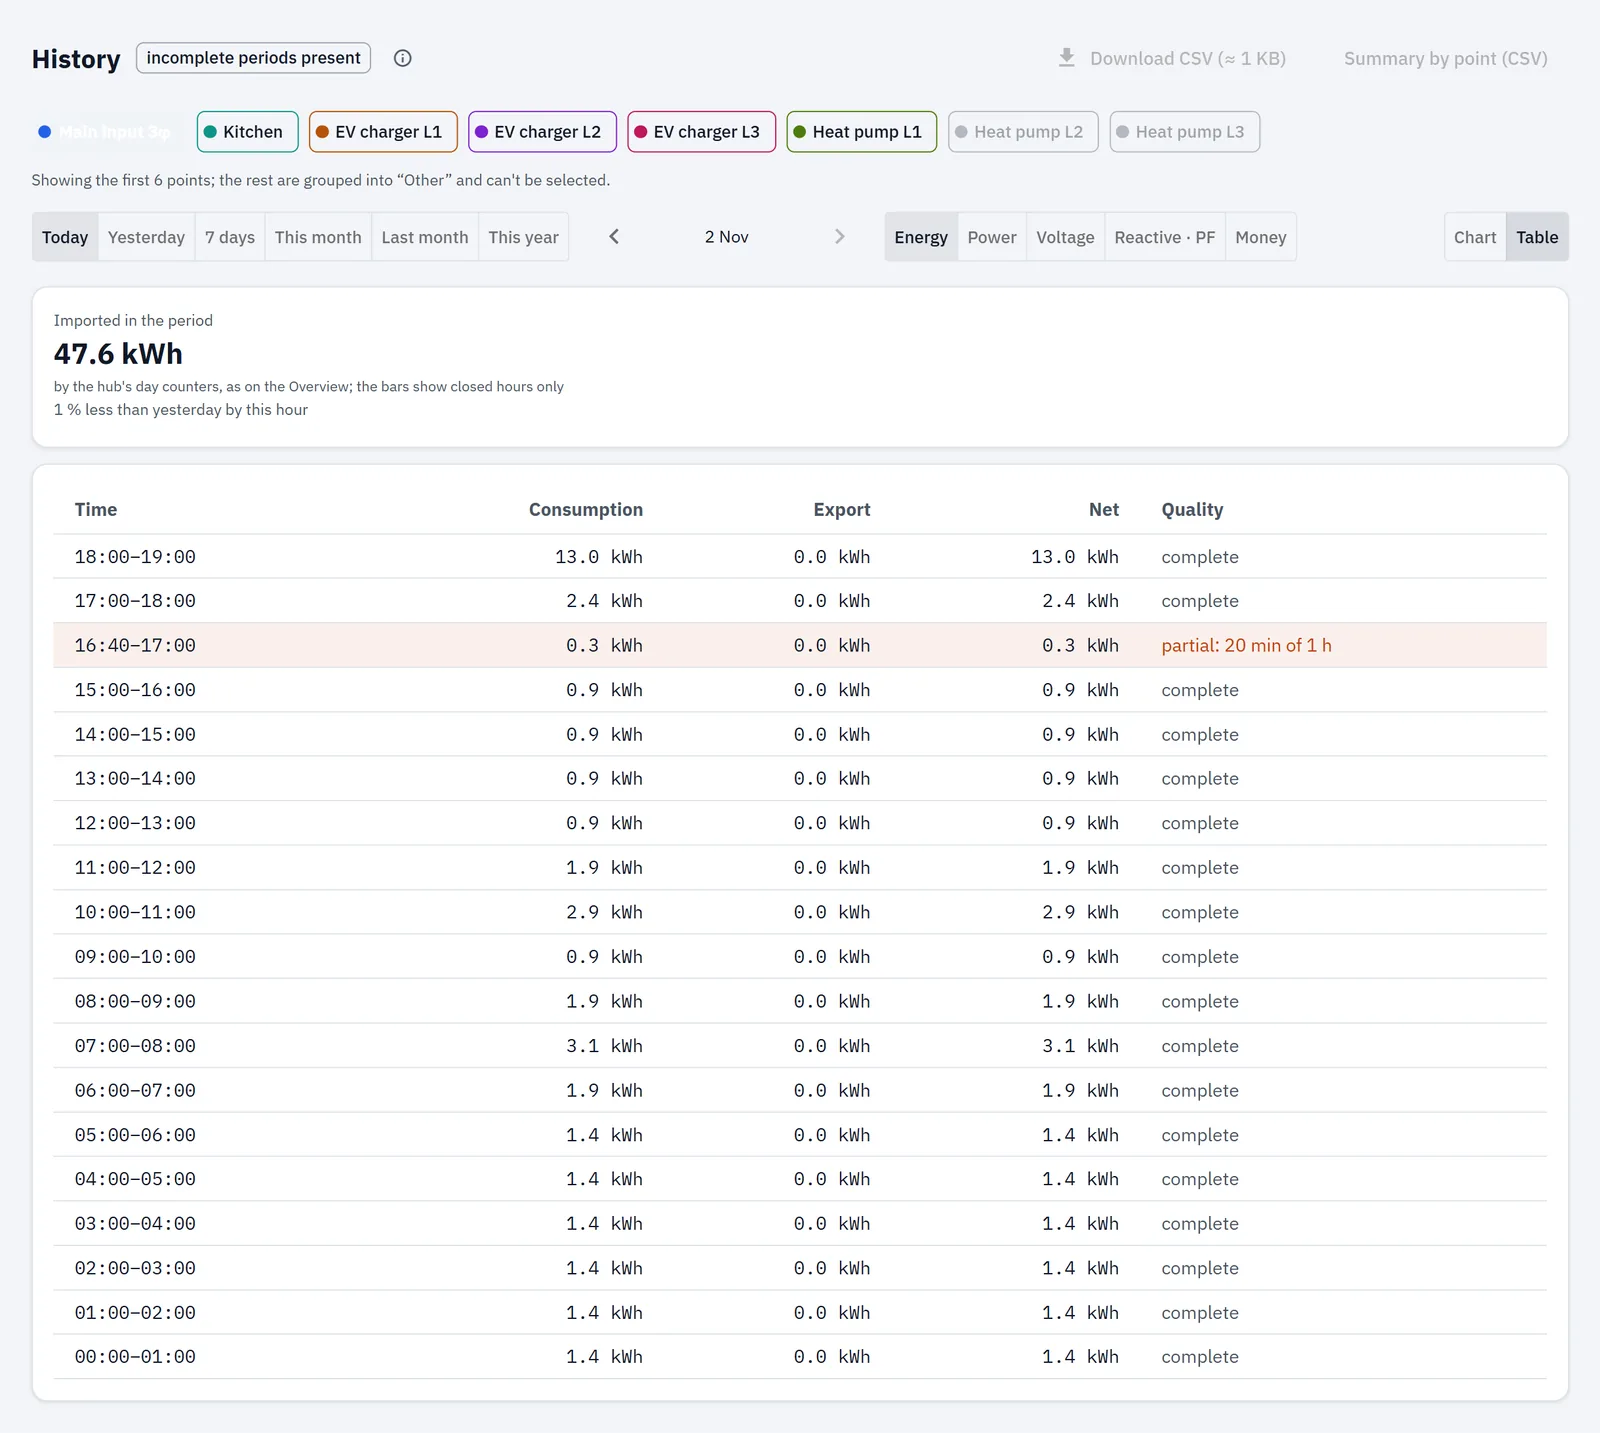
Switch between Chart and Table. The table lists the same records, newest first. An hour row reads as an interval, such as "16:00–17:00".
| Metric | Columns after Time | Last column |
|---|---|---|
| Energy | Consumption, Export, Net | Quality |
| Money | Cost, Export value, Net | Quality |
| Power | Power, Min, Max | Quality |
| Reactive | Q, PF, S | Quality |
| Voltage | Voltage, Min, Max | Quality |
On a phone, the third figure and the Quality column are hidden, and the quality text moves under the time.
Points on a BASIC module count consumption only, without direction. For Energy and Money the table shows only the first column, with a note that these records carry no export.
Quality
The Quality column says how complete each record is:
- complete;
- partial: 20 min of 1 h (how much of the period was recorded);
- longer than the period: {duration}, for example "longer than the period: 1 h 15 min";
- recomputed from the hour records (a day rebuilt from its hours).
It also lists any of these notes:
| Note | What it means |
|---|---|
| clock not synced | the hub's clock wasn't set when the record was made |
| clock step | the hub's clock jumped during the period |
| sensor data gap | readings were missing for part of the period |
| recomputed | the record was recalculated |
| estimate: a window over 6 h, lower accuracy | the value was estimated over a long gap |
| consumption only (a source without direction) | the source doesn't measure direction (for BASIC points the table says this once, above itself, instead of on each row) |
| clipping: the current hit the sensor's limit — energy under-counted | the current went above what the sensor can measure |
| migrated from the old format | the record was converted from an older storage format |
| the module restarted — energy before its restart wasn't measured | the rbAmp module restarted during the period |
| the module firmware changed | the module's firmware was updated during the period |
| sensor reversed — consumption not metered | the current sensor seems to be fitted backwards |
Partial rows have a soft red background. Records made before the hub's clock was set show "before sync" and are left off the charts.
Incomplete periods, restarts and live-only points
Incomplete periods. A record is partial when it covers less than its full hour, day or month, usually because the hub was off or restarting. Its value is right for the time the hub ran. When the window holds such records, the header shows incomplete periods present. On bars, a partial slot is hatched; on lines, a partial point is a hollow ring. The legend calls it "Incomplete period".
Gaps. A missing hour or day stays an empty slot or a break in the line. The chart never joins across a gap.
Restart gap. If the hub was down for at least a minute inside the window, a note says when, for example "The hub was down 16 Oct, 03:12 – 03:20 (restart): no records for that time." Only the hub's latest restart is reported. "Today" on the Overview still counts that energy from the hub's counters.
Live-only points. A point that keeps no stored history shows a note: "name shows live values only — it has no stored history." It is followed by one of:
- "The hub keeps history for 12 points." — all 12 history slots are taken;
- "Restart the hub to start its history." — the point was bound while the hub was running; its history starts after the next restart.
Slow or lost connection. If the records take more than 12 seconds to load, the page says "The hub is slow to answer — still waiting for the archive…". With no connection it says "No connection to the hub — the archive will load when it's back."
If loading fails, the page shows "Couldn't load history."; a period with no records shows "No data for the selected period."
Downloads
Both downloads are built in your browser; the hub doesn't create a file. Download CSV uses the records on screen. Summary by point asks the hub again for each point's energy and money records for the period, whatever metric is on screen.
Download CSV
Download CSV saves one file with all selected points, for the period and metric on screen. The button shows a rough size estimate, and is greyed out when there is no data.
Columns: Interval start (hub clock, with its UTC offset), Point, the metric's columns, Duration, min and Status.
| Metric | Columns | Decimals |
|---|---|---|
| Energy | Imported, kWh · Exported, kWh · Net, kWh | 3 |
| Money | Cost · Export value · Net, with the currency code (for example "Cost, EUR") | 2 |
| Power | Power, W · Min, W · Max, W | 1 |
| Reactive | Q, var · PF · S, VA | 1 (PF: 2) |
| Voltage | Voltage, V · Min, V · Max, V | 1 |
- Duration, min is in whole minutes.
- Status says "partial" when a record is more than a minute short of its hour or day.
- Energy and Money files end with one "Sum of the period's records" row per point.
- A record that lies inside a longer record of the same point is left out, so the same energy isn't counted twice.
- Numbers follow the number format chosen in Settings → Interface (with "as the language", your app language). With a decimal comma, the file uses
;as the separator and starts with a UTF-8 marker, so it opens directly in spreadsheet apps set up for that format; otherwise,.
Summary by point
Summary by point (CSV) saves one row per selected point for the period on screen: imported kWh, cost, exported kWh and export value. The first row names the period.
- The input's row is labelled "(input, includes the lines)".
- The last row is Total of the lines when the input and at least one line are selected (the input isn't added on top of them). Otherwise it is Sum of the period's records, summed over the selected points.
- On running periods it uses the same figures as the totals card.
If a file can't be built, the app says "Could not build the file."
Links to a view
You can open History on a chosen view with a link:
http://<hub address>/#/history?point=<point ID>&win=<period>&metric=<metric>&view=<chart|table>
In the app at webapp.rbgrid.io the same link starts with https://webapp.rbgrid.io/#/history?….
| Parameter | Values |
|---|---|
point |
the point's ID, or its 4-digit unit ID as shown in the point's settings (for example 0006); upper or lower case. An unknown point is ignored. |
win |
today, yesterday, week, thisMonth, lastMonth, year |
metric |
energy, power, voltage, reactive, money |
view |
chart, table |
Unknown values are ignored. The app applies the parameters once, then removes them from the address, so going back or refreshing keeps your own later choices.
The As a table link on a point's page uses this: an hourly trend opens Today, a daily or weekly trend opens This month, with the trend's metric and the table view. The Overview's energy chart has an As a table link too: it opens Today, Energy (or Money in the money view), as a table.